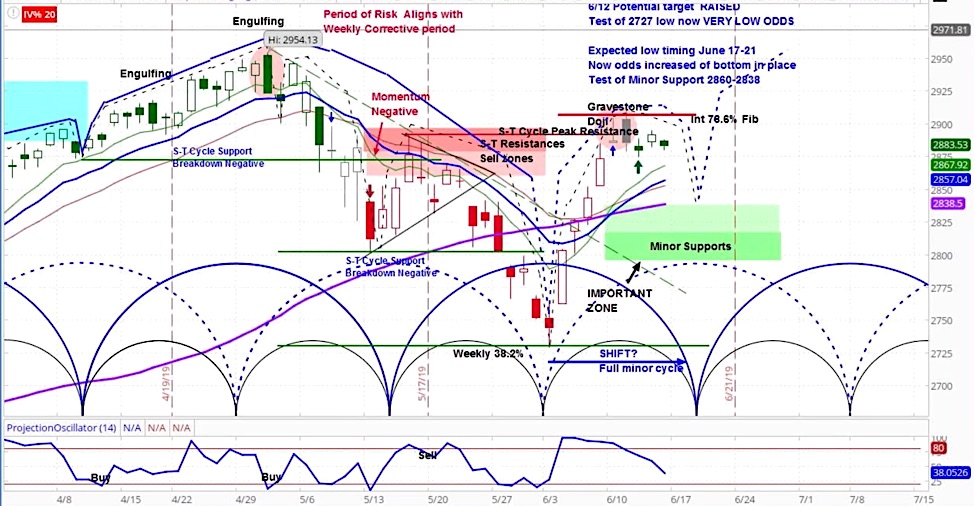
S&P 500 “Cycles” Chart
The S&P 500 (INDEXSP: .INX) rose 14 points last week to 2887, an increase of 0.5%. Stocks were hit by technology company Broadcom (NASDAQ: AVGO), as it fell 5% on mixed earnings and a dim outlook.
Our projection this week is for stocks to dip to support zone between 2800-2838 before rising again once a new market cycle begins.
Our approach to technical analysis uses market cycles to project price action.
Our analysis for the S&P 500 is that based on this strong rally, the cycle has shifted out. This means that we are now only expect a shallow declining phase before the new cycle begins with a new rally.
Our expectation is for a down and then up week, with our support zone at 2800-2838.
Stock Market Outlook Video – Week of June 17, 2019
The stock market posted modest gains last week as it focused on the possibility that central banks around the world would cut interest rates again, as I pointed out in the latest Market Week show.
This occurred despite the poor economic data that continues to emerge. While Japanese GDP exceed market expectations, the UK data disappointed including negative prints for GDP and manufacturing production. Meanwhile US job openings, CPI, and retail sales all missed expectations, as Chinese industrial production also missed.
For more from Slim, or to learn about cycle analysis, check out the askSlim Market Week show every Friday on our YouTube channel.
Twitter: @askslim
Any opinions expressed herein are solely those of the author, and do not in any way represent the views or opinions of any other person or entity.


