The Tilt-A-Whirl is a flat ride used at amusement parks, fairs and carnivals.
It is a platform-type ride with several freely spinning cars which are attached at fixed pivot points on a rotating platform.
I am not a huge fan of rides that upset one’s equilibrium, but I do find the Tilt-a-Whirl palatable.
More importantly, it is a ride that spins on fixed points, and that is exactly what we can see happening with several important stock market ETFs that we follow.
The weekly stock charts show lots of spinning in place. Whilst spinning, investors are experiencing a sense of imbalance.
The stock market gyrates up and down, but ultimately, that freely spinning index or sector (excluding commodities here), wind up back at the fixed pivot point.
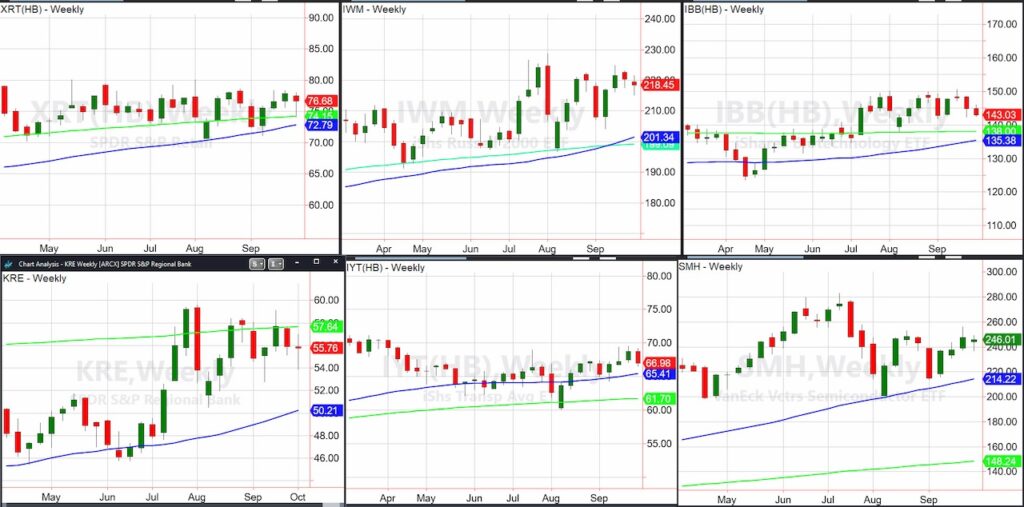
This can be seen particularly in the Retail sector ETF (XRT)… after wars, weather, strikes, jobs reports, and Fed speak, it is still in a trading range that basically dates to January 2024.
Why is this significant?
Because when that range breaks one way or another, the move will be strong and for those on the right side, profitable.
XRT and the Russell 2000 ETF (IWM) have the clearest trading ranges going back the whole year.
That is what we are focused on mainly.
However, the Biotech sector ETF (IBB) is also in a trading range starting from July.
The Regional Banks ETF (KRE) have the same timeline.
The Transportation sector ETF (IYT) is more volatile this year, unsurprisingly.
But that sector also trades between $60-$71.
The sector that has had the most volatility though is the Semiconductors (SMH).
Before we look at SMH, we must look at crypto-currencies through the lens of Bitcoin.
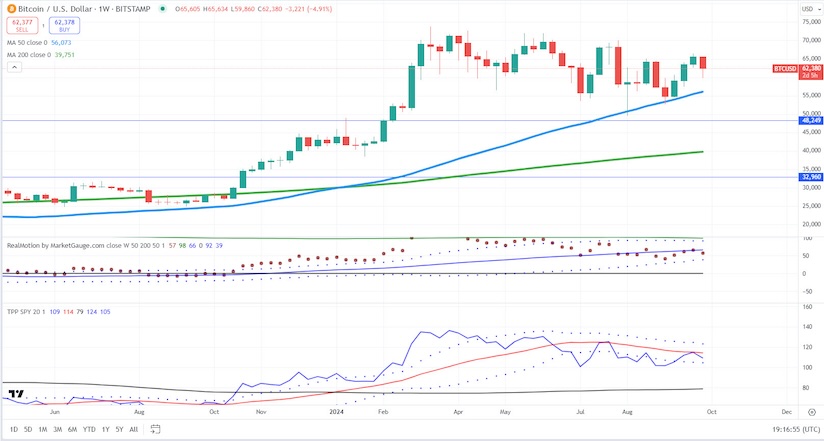
Talk about a Titl-a-Whirl!
If we put the bears on one spinning car and the bulls on the other, where do they wind up at the end of ride?
In the middle of the same trading range it has been in since February.
The point of this is extremely simple:
Unless you love the thrill of the ride to nowhere, just wait.
Once the ranges break, you will be in control of the ride, rather than the reverse.
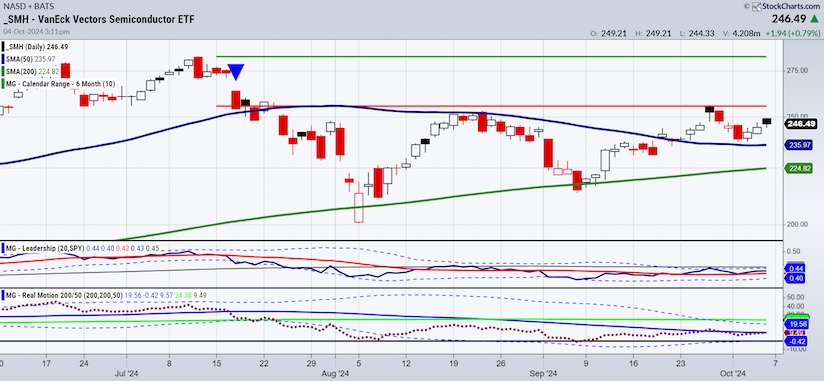
This is the Daily chart of Semiconductors (SMH), which I show you because the sector has underperformed this year.
While currently SMH on the Leadership chart shows an outperformance to SPY, the July calendar range from July tells a different story.
SMH is under the July 6-month calendar range, yet in a bullish phase.
Real Motion Is in a strong bearish divergence.
Since mid-July, we can see that 256 is the resistance to clear. However, the support levels are not as clearly defined.
Once again, I give you the notion that we must watch how XRT, IWM and IYT reconcile.
And in the meanwhile, also make sure SMH does not fail 235 or the 50-day moving average.
But until then, be patient, be active, and be optimistic that these ranges will not only reconcile but also give us many trading opportunities in the coming months.
Twitter: @marketminute
The author may have a position in mentioned securities at the time of publication. Any opinions expressed herein are solely those of the author and do not represent the views or opinions of any other person or entity.
")

, Bitcoin (IBIT), Symbotic (SYM)")


, Bitcoin (IBIT), Symbotic (SYM)")