Here is a brief review of change in short interest in the November 1-15 period in nine S&P 500 sectors (by time of publication, short interest for the Nasdaq and the NYSE Group has not yet been published).
Of the nine, short interest rose in six p/p (XLF, XLI, XLK, XLP, XLU, XLY). Five were above their respective 50-day moving average (XLB, XLE, XLF, XLI, XLY) and four below (XLK, XLP, XLU, XLV).
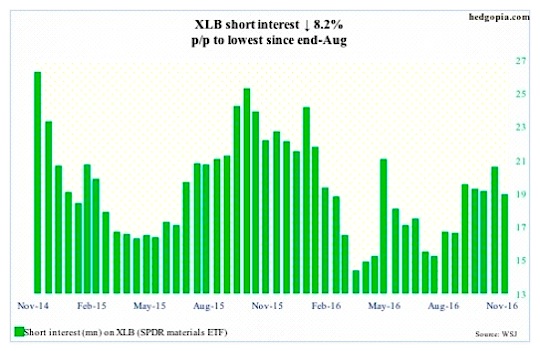
SPDR Materials Sector ETF (NYSEARCA:XLB) – short interest ↓ 8.2% p/p, ETF ↑ 3.7%
On November 3, XLB found support at the lower Bollinger band, and never looked back, further bolstered by the Trump rally; resistance at $49-plus stopped the advance during the period. This probably led shorts to not give up completely. Short interest was down but not huge.
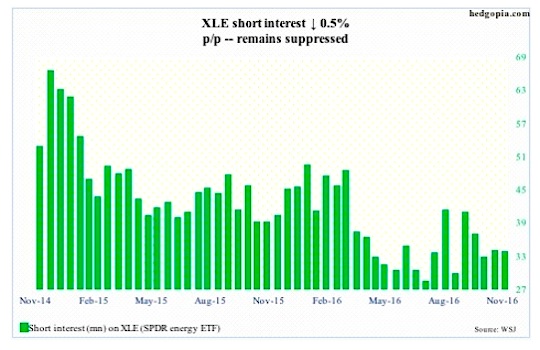
SPDR Energy Sector ETF (NYSEARCA:XLE) – short interest ↓ 0.5% p/p, ETF ↑ 4.7%
Since April this year, XLE has been trading within an ascending channel. Early this month, it found support at the lower end of that. This should have caused shorts to cover.
With that said, short interest was already suppressed. Shorts got squeezed big time as XLE bottomed in January this year, and they have been hesitant since. Rightly so, as the ETF rallied big during the reporting period.
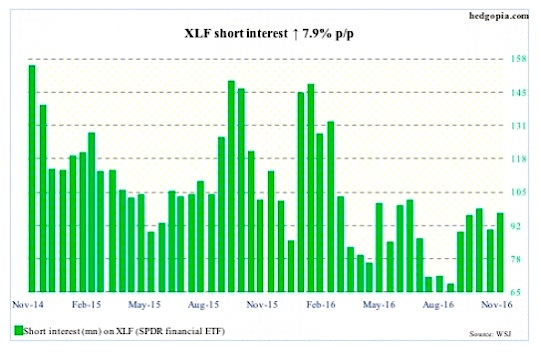
SPDR Financial Sector ETF (NYSEARCA:XLF) – short interest ↑ 7.9% p/p, ETF ↑ 12.4%
Of the nine sectors, XLF rallied the most during the period. The November 9th jump forcefully pushed it past resistance at $19-plus, which goes back nearly two years – or can be extended as far back as March 2004. The ETF ($22.41) is still below the all-time high $25.51 it reached in May 2007, but November has produced a tall, white candle.
Going into this, shorts had been hesitantly adding. Although the current level of short interest is nowhere near the level from early this year. Importantly, the massive rally in XLF did not dissuade shorts from adding more.
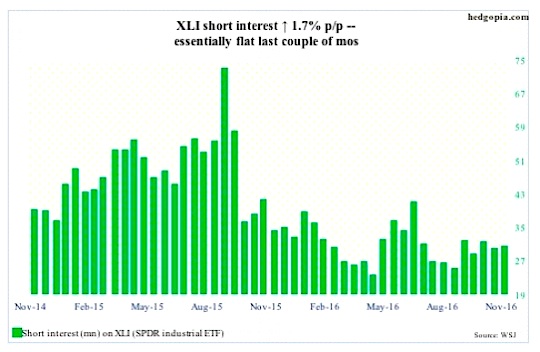
SPDR Industrial Sector ETF (NYSEARCA:XLI) – short interest ↑ 1.7% p/p, ETF ↑ 7.6%
Before the Trump effect could do its magic, XLI early this month defended horizontal support at $56-plus extending back to February last year. Then came the November 9th surge, past a declining trend line from the middle of August this year.
Short interest was already suppressed going into this. The rally was not caused by a squeeze.
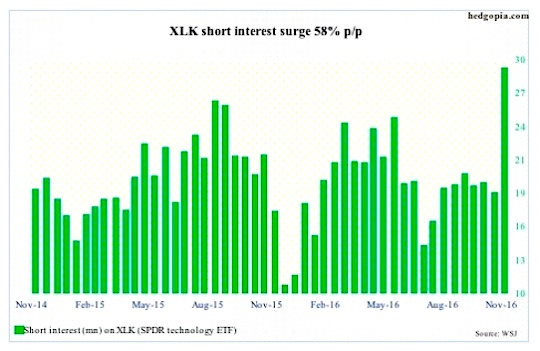
SPDR Technology Sector ETF (NYSEARCA:XLK) – short interest ↑ 58% p/p, ETF ↓ 1.6%
The ETF started the reporting period by losing the 50-day moving average. The November 9th rally was followed by a higher-volume red engulfing candle. Shorts have apparently taken this as a sign of weakness. Notice the surge in short interest!
Tech stocks have underperformed – relatively – post-Trump victory. The Nasdaq composite was only up 1.7 percent. And the Nasdaq 100 was down 0.8 percent, which is what XLK followed.
read more on the next page…

