Stock market bears won the dog fight from the bulls and the agnostics today, as the S&P 500 (SPY) fell -0.66% (after recovering from deeper losses).
Was this the dip to buy, or the start of a more major selloff for stocks?
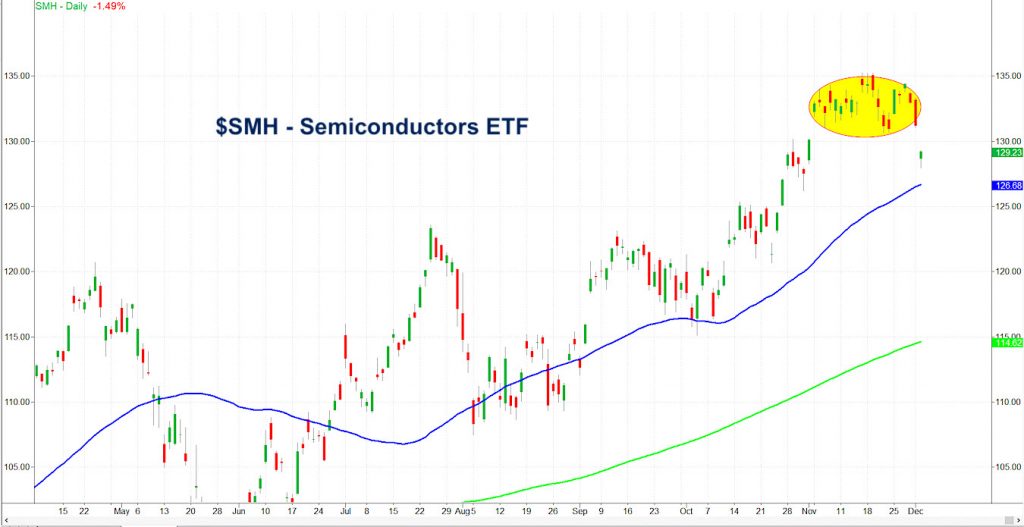
The Semiconductors ETF (SMH) might have the most interesting chart pattern and should hold the key to the next move in the overall stock market.
On November 4, SMH gapped higher. That gap made a new all-time high, creating a clean breakaway gap.
That is, until today. What makes today’s move interesting, is that we now have a potential island top.
If the gap to 130.60 (the low until today) is not filled, then one can assume that more selling is in store.

The 50-day moving average is the blue line at 126.68. That could turn out as price support for the Semiconductors.
However, if SMH and semiconductors cannot rally above 130 or so in the next 2-3 days, then bears and many agnostics, will have sunk their sharp teeth into the bulls.
S&P 500 (SPY) 312 is pivotal price resistance; 303 is major support.
Russell 2000 (IWM) 160-160.46 is price resistance and 157.74 is support.
Dow Jones Industrials (DIA) 279.25 is pivotal price resistance and 272 is support.
Nasdaq (QQQ) 203.25 is pivotal price resistance and 196 is underlying support.
KRE (Regional Banks) 56.00 is pivotal price resistance and 54.25 is major support.
SMH (Semiconductors) 130.60 is price resistance and gap fill it needs; 127 is support.
IYT (Transportation) 188.25 is key price support. And if it fails, it will impact everything; 190 resistance to clear.
IBB (Biotechnology) 116.30 is key price support; 120 is resistance.
XRT (Retail) 44 is price resistance; 43-43.35 is key support.
Twitter: @marketminute
The author may have a position in the mentioned securities at the time of publication. Any opinions expressed herein are solely those of the author, and do not in any way represent the views or opinions of any other person or entity.


