I have read so many scary headlines this week.
And let’s face it, the stock market sell-off, especially in quantum computer stocks, is sobering.
Please though, pay attention to price and not headlines or you will go nuts.
If there is ever a year to learn about our core following of stock market ETFs (the Economic Modern Family), weekly charts and phase changes, this is the year.
You hear it’s a stock picker’s market? It always is. The difference is that for 2 years everyone picked tech and growth because it was bullish and obvious.
This year, a stock picker’s market means you better have a clue how to follow price action because fundamentals are up for grabs!
- Quick reminder, if you have not read the Outlook 2025, please do.
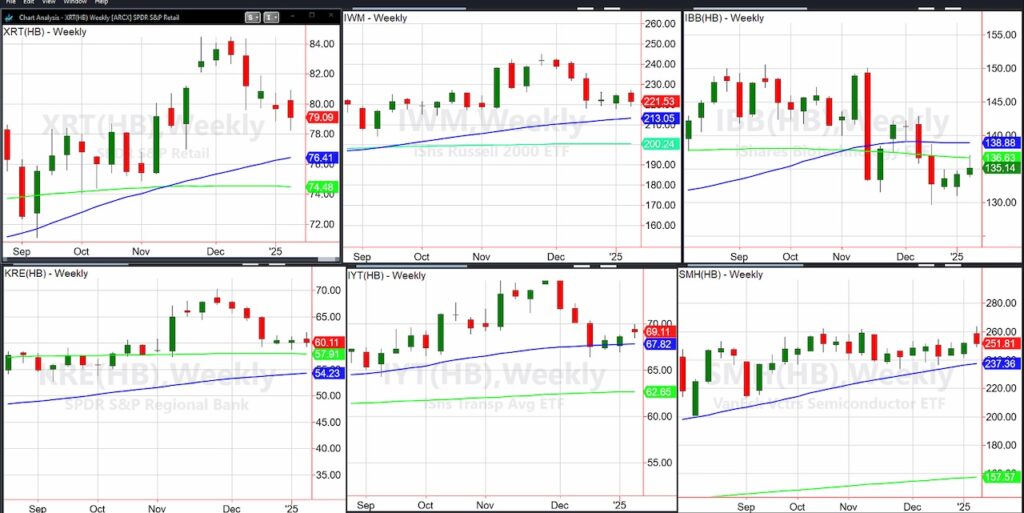
Starting with the Retail Sector ETF (XRT), it might be my biggest focus for how bearish or bullish to be right now. The weekly phase is Bullish. Until that changes, this is a correction. Plus, as long as XRT holds 78.00, it’s back where it broke out from after a massive consolidation last year.
The Russell 2000 (IWM), is also in a weekly bullish phase. Not too worried unless price breaks down under the moving averages.
The Biotechnology Sector ETF (IBB), in a weekly Distribution Phase. 130 is key support. Over 140 in the clear.
The Semiconductors Sector ETF (SMH), still hanging tough over the 50-week moving average. Only if that changes do we start to worry. And 260 is a key resistance level to clear.
The Transportation Sector ETF (IYT), the clutch sector, held the 50-week moving average. As IYT can be a leader, we want to see it clear 70 and hold 67.
The Regional Banks Sector ETF (KRE) remains the one sector still in a weekly Accumulation Phase as the 200-WMA is above the 50-WMA. Hence, a relative weak link that was a factor in 2023. Can that drag everything down again in 2025? Under 54 I would worry. Otherwise, not too concerning.

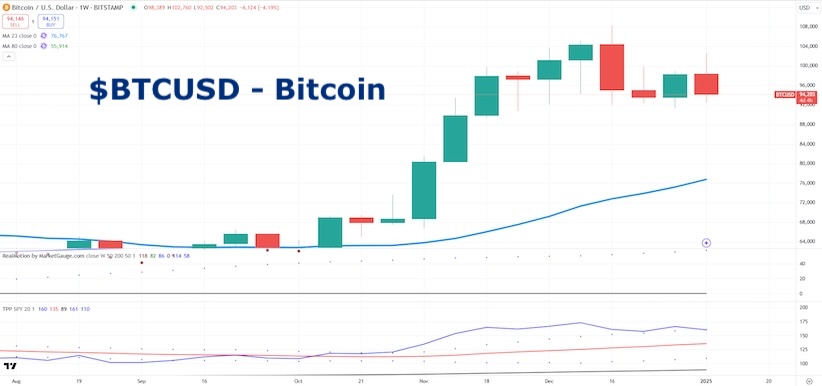
Crypto as seen through Bitcoin, is in a weekly Bullish phase. The leadership versus the benchmark is solid. After halving in 2024, BTCUSD consolidated with resistance at 76k. Now, that is major support and where the 50-WMA lives. It would be ugly getting there, and hardly a guarantee that it will. But if it does, that could be the gift of 2025. Otherwise, another weekly close over 104k should take it to 130k.
Again, charts matter. Learn how to read them. Headlines are great for daytraders and distracting for everyone else.
Thursday is the Day of Mourning for President Jimmy Carter, and the markets are closed.
Twitter: @marketminute
The author may have a position in mentioned securities at the time of publication. Any opinions expressed herein are solely those of the author and do not represent the views or opinions of any other person or entity.


