Every week we review the big picture of the market’s technical condition as seen through the lens of our Big View data charts.
For Technical Monday, I want to focus on 3 key relationships ahead of this week’s Federal Reserve meeting.
- The S&P 500 etf (SPY) versus the Long Bonds etf (TLT)
- The Junk Bonds etf (HYG) versus the Long Bonds etf (TLT)
- Gold etf (GLD) versus the S&P 500 etf (SPY)
These relationships are all pointing towards risk off, meaning that the equity market could sell off.
However, these relationships, if change this week, will prove invaluable for making your next investment decisions.
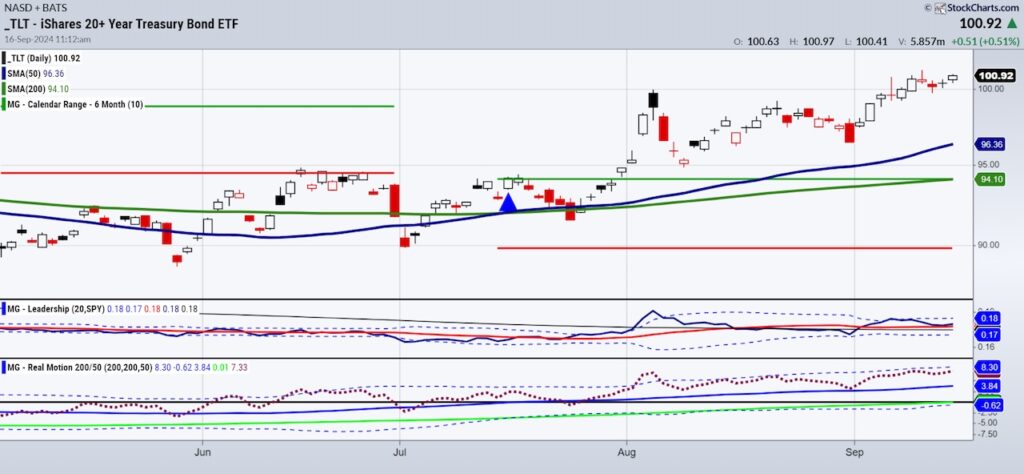
The first chart shows the long bonds TLT, the price action, triple play or leadership versus the benchmark, the calendar ranges and the real motion or momentum.
TLT price breakout was over 100. TLT cleared the July calendar range high a while ago and is in a bullish trend.
Momentum is steady ahead of the Fed decision.
The key here is that TLT outperforms SPY. That is risk off.
One big clue this week is if TLTs rally more and SPY begins to rollover.
That will be negative for equities and more bullish for long-term bonds and most likely, commodities.
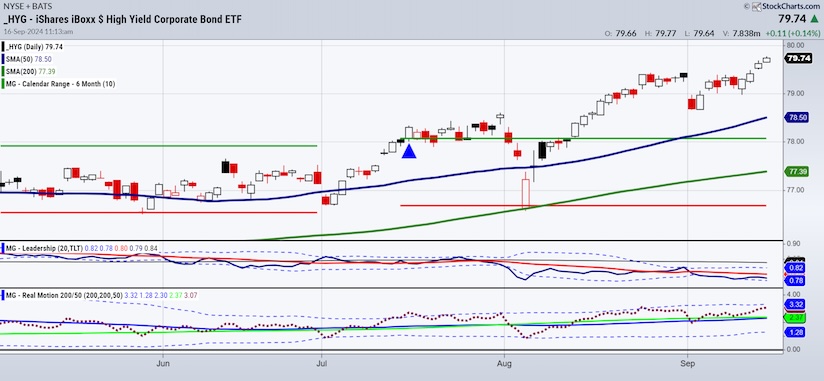
This chart is extremely interesting.
Remember, as we know with SPY trading near the all-time highs, it is the relationships we need to watch.
Junk bonds look amazing and are well above the July calendar ranges.
What is scary though, is that HYG underperforms the long bonds TLT.
This is the next relationship that needs to be on your radar-if junk bonds sell off and long bonds rally, use caution as this is another indicator or risk off.
Of course, if the long bonds sell off and junk bonds hold or rally more, that is better for equities.
Last week I did another podcast with Financial Sense (link below).
I have done several through the years. They are highly educated in the markets, and we often agree on many areas of where to invest or not, your money.
As you will see on the next chart of gold GLD, the topic of stagflation continues to play out and Cris Sheridan of Financial Sense agrees.
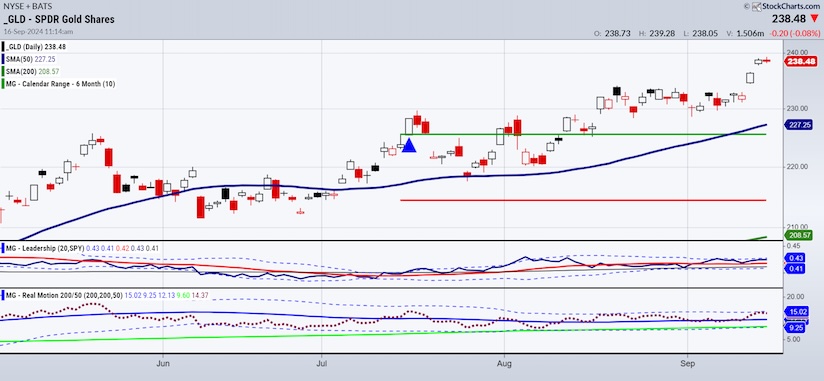
The gold chart and this most recent rally to new all-time highs, took a while, but was completely expected by us at MarketGauge.
We are long for our clients and have been so for some time now, and quite vocal about it too, I might add.
Gold has rallied to over $2600 as a flight to safety.
It is outperforming SPY which is risk off.
The momentum is increasing as well as gold remains well above the July calendar range.
Here again, is the key to what happens next in gold and SPY.
If gold continues to march higher, perhaps the reasons can flip to more inflation than just safety from risk.
And that also means lower prices in store for SPY.
3 charts, 3 relationships, 3 critical areas to watch without listening to analyst guesses.
Twitter: @marketminute
The author may have a position in mentioned securities at the time of publication. Any opinions expressed herein are solely those of the author and do not represent the views or opinions of any other person or entity.
: Creating Bullish Divergence?")


 and Semiconductors (SMH): Concerning Price Pattern?")


