May 13 Stock Market Outlook and Technical Review
Here’s a look at some key stock market indicators, charts, and themes that we are watching:
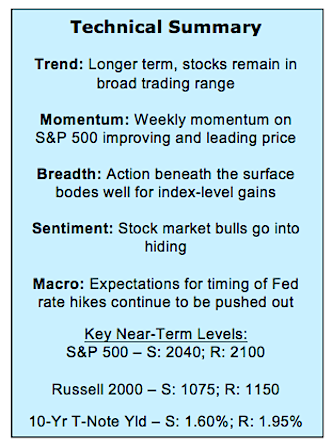
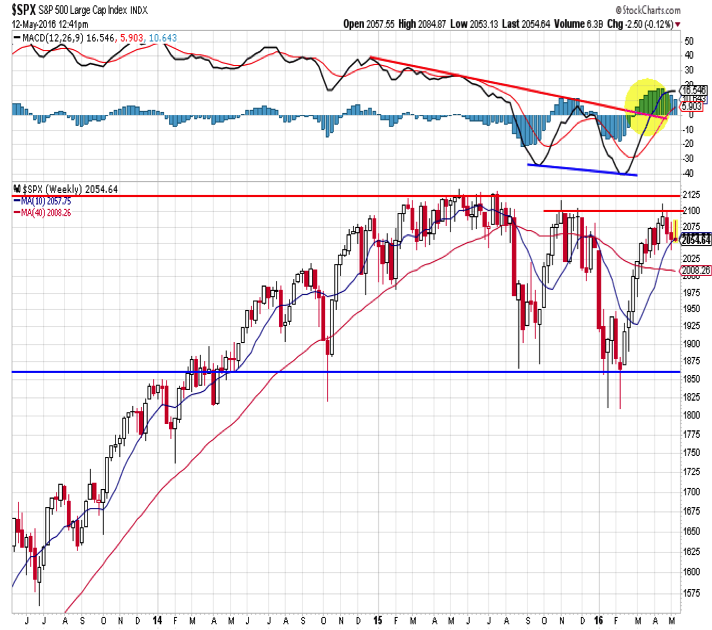
Stocks in Consolidation Mode – For all of the daily (or intra-day) noise, stocks are going nowhere fast. The S&P 500 is almost exactly where it began 2015, and has traded at its current level in six of the past seven weeks (counting the current week). While price is consolidating on the weekly chart, momentum has broken out to the upside, supporting the stock market outlook and view that the path of least resistance is higher.
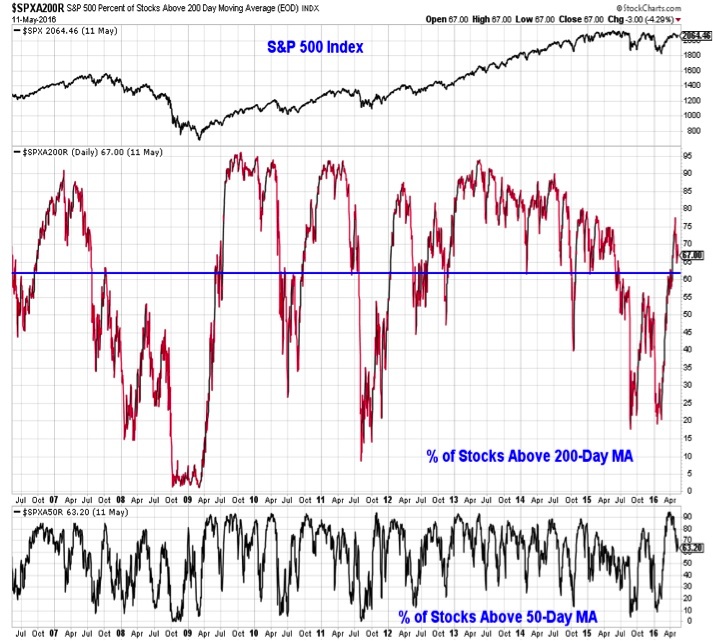
Broad Market Holding on to Gains – Encouragingly, the broad market has been able to hold the bulk of its recent gains, even as small-cap stocks have started to lag in recent weeks. The percentage of S&P 500 stocks trading above their 200-day averages remains robust, and our industry group trend indicator continues to show broad strength.
Seeing More Pessimism for Stocks, Dollar; Optimism on Gold and Bonds – While individual sentiment surveys can at times be misleading, most now point to a curtailing in investor optimism (if not outright pessimism). Optimism has evaporated as stocks have consolidated and that could be fuel for a rally. Sentiment extremes are showing up elsewhere as well.
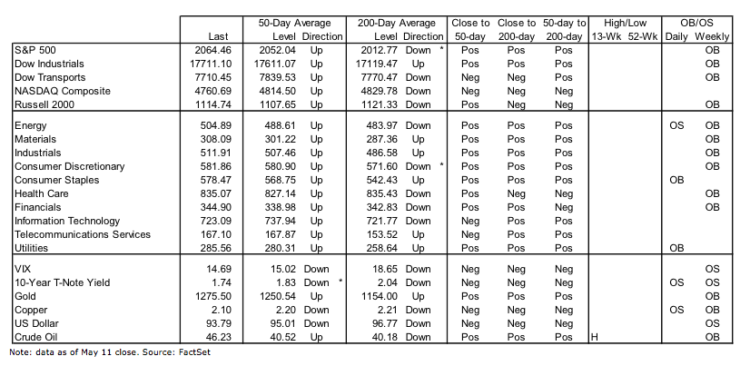
Stock Market Indicators – Indices & Sectors (click to enlarge)
S&P 500 Index
The S&P 500 has so far failed to get through resistance near 2100, with the consolidation following the rally off of the early-year lows coming just below that level. Price has been relatively resilient in the face of increased investor pessimism (more on that in a moment) and persistent outflows from mutual funds and ETFs. Momentum has broken out to the upside and that positive divergence could be fuel for further rally attempts.
The percentage of S&P 500 stocks trading above their 200-day average has pulled back from its recent peak (in the upper 70s) but remains robust. While this is a similar level to what was seen at this time last year, the context could hardly be different. Last year, new highs in the S&P 500 were being accompanied by fewer and fewer stocks still trading above their 200-day averages. Now, we are seeing the average stock take a leadership position. As of earlier this week, two-thirds of the stocks in the S&P 500 were positive YTD and the median stock was up 5.5%, about 400 basis points better than the index.
Stock Market Sentiment
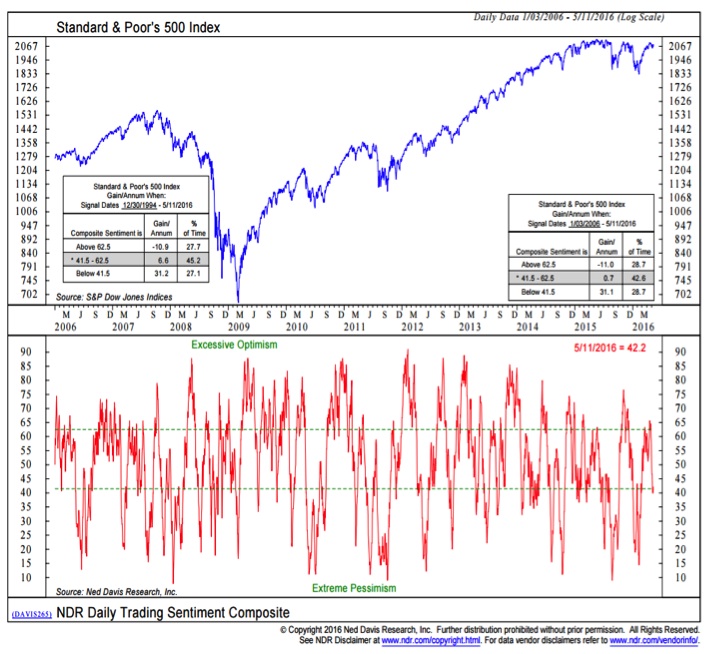
Individual sentiment indicators can sometimes be picked to tell a specific story. Right now, however, they seem to be largely in agreement. The hints of optimism that emerged as stocks rallied off of their lows has dissipated over the past few weeks. The AAII survey shows the fewest bulls since the February lows (bears are still well shy of their peak), active investment managers have sharply curtailed equity exposure according to the NAAIM, equity mutual funds and ETFs continues to see outflows and demand for put options has expanded. For contrarians, this bodes well for the stock market outlook.
From the perspective of a composite indicator, the NDR Daily Trading Sentiment Composite has recently moved back into excessive pessimism territory after showing only the briefest flash of optimism.
S&P Information Technology Sector
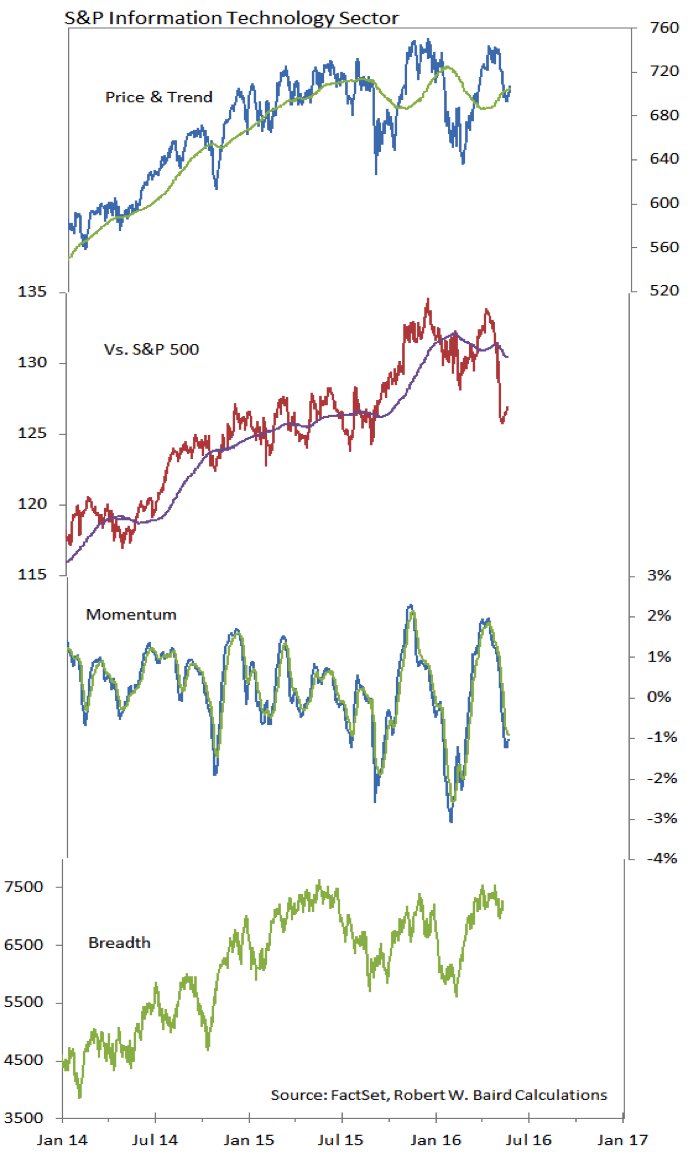
Technology enjoyed a brief stay at the top of our relative strength rankings before the ongoing sector-level leadership rotation sent it toward the bottom of the rankings. While the price moves on both an absolute and relative basis have been signficant, longer-term up-trends remain intact. Further, breadth has been surprsingly robust, suggesting there is strength in the sector beneath the surface.
Thanks for reading.
Further reading: Economic Update: Higher Wages A Boon For Workers
Twitter: @WillieDelwiche
Any opinions expressed herein are solely those of the author, and do not in any way represent the views or opinions of any other person or entity.

