Here’s a look at some key stock market indicators, charts, and themes that we are watching.
This Week’s Stock Market Outlook:
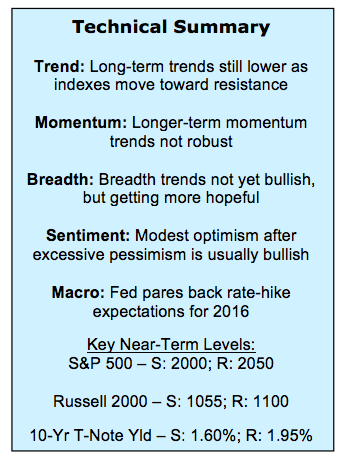
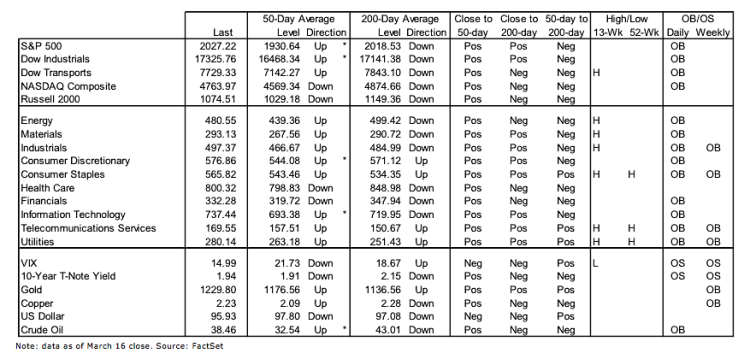
Small-Caps Moment In The Sun – The Russell 2000 led the rally off of the February lows, or at least the first few weeks of it. Over the past few weeks small-caps have again ceded leadership to large-caps. While last week’s new recovery high for the Russell 2000 provided hope that small-caps were getting back in gear, price and momentum trends remain challenged.
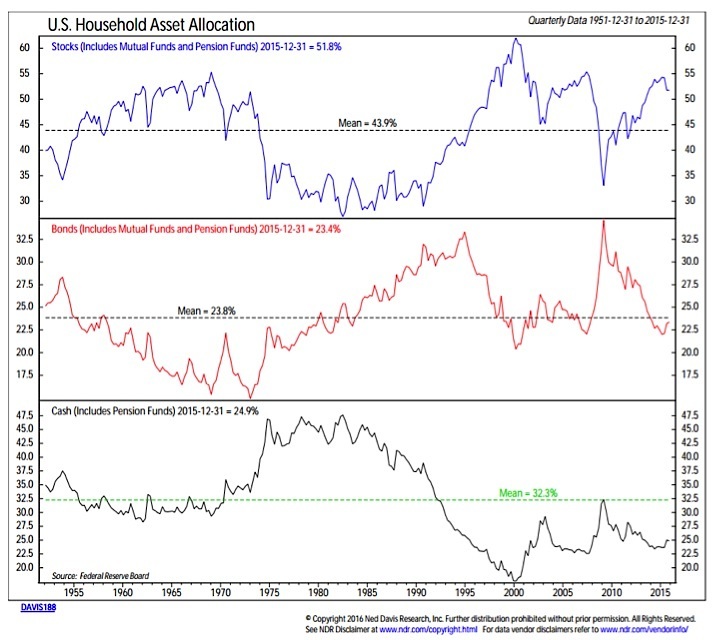
Household Equity Allocations Remain Elevated – Despite the outflows from equity funds in recent months, household exposure to stocks remains high and there is little evidence of actual cash building on the sidelines. Investor fear and pessimism is primarily useful if it indicates unused buying power. Right now, that is not evident.
Dow Transports Getting Bullish Attention – The rally off of the February lows continues to distinguish itself from the rally off of the September 2015 lows. In addition to the various buying thrusts and expansion in issues making new highs, we are seeing the Dow Transports getting back in gear. If weakness there was a bearish harbinger in 2015, perhaps strength there is a bullish harbinger for the remainder of 2016.
Stock Market Indicators – Indices & Sectors (click to enlarge)
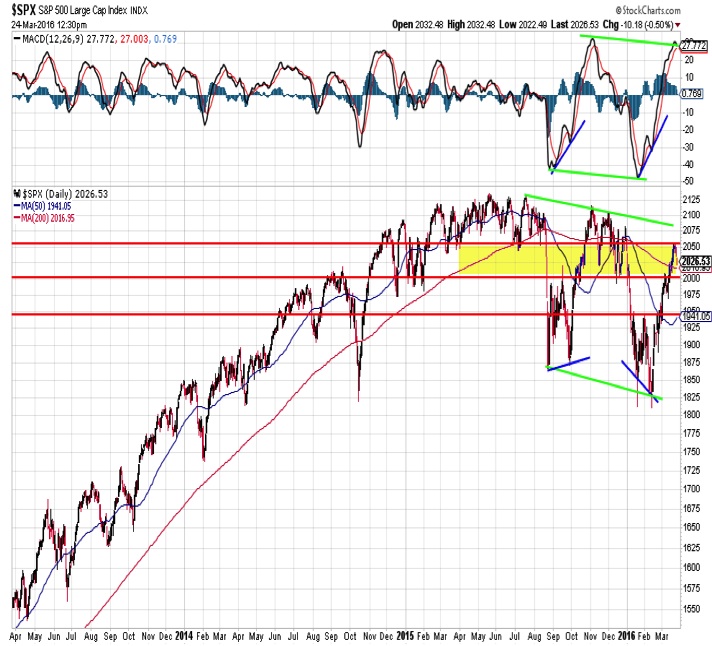
S&P 500 Index
The S&P 500 rally off of the February lows remains in a testing phase. Resistance near 2050 has withstood the initial test, and momentum is now turning lower. If the S&P 500 is able to consolidate just below resistance, it could provide a chance for the 200-day moving average to turn higher. This would add to evidence that the downtrend is yielding to a new up-trend. Support near 2000 looks important. A failure to hold that level could yield to a more significant test of the February lows (1940-1950 could quickly come into play).
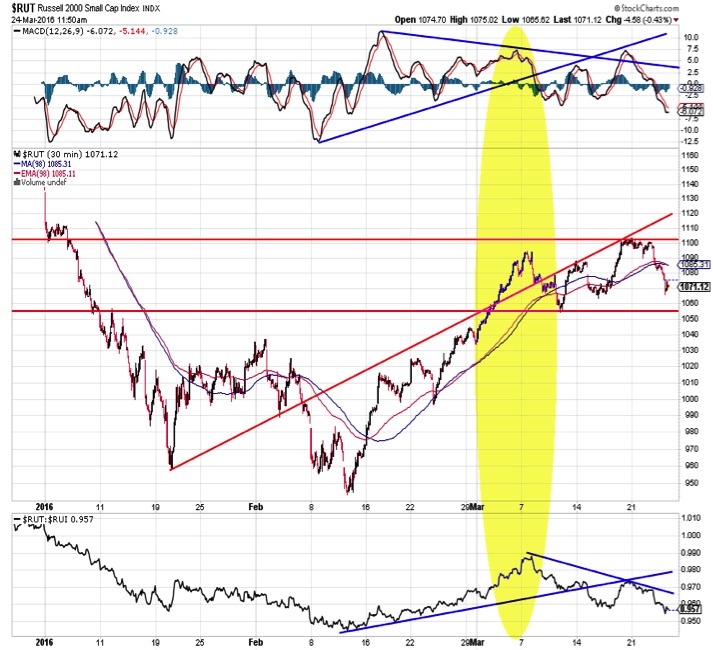
Russell 2000 Index
Small-caps have been underperforming large-caps this week as the Russell 2000 was unable to build on last week’s surge to a new recovery high. While small-caps led the initial bounce off of the February lows, they have actually been lagging for several weeks now. On both a price and momentum basis, the short-term trends for small-caps have deteriorated since the first week of March. Resistance on the Russell 2000 remains near 1100, with support near 1055.
Equity Fund Flows And Asset Allocations
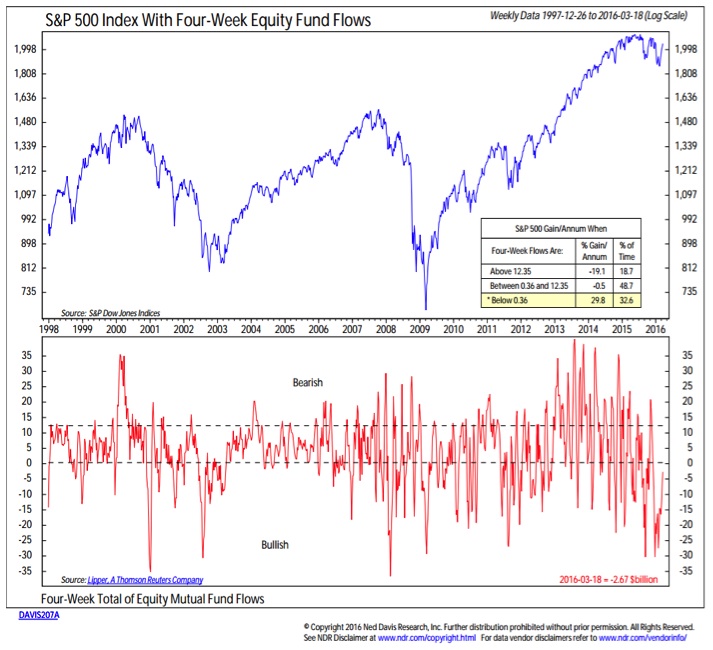
The pace of equity mutual fund outflows has slowed, but it remains in a bullish mode for stocks. This is generally consistent with the recent sentiment survey readings. Bulls on the Investors Intelligence survey rose this week to 47%, the highest level since July. Bears moved down to 28%, but are still twice as high as they were this time last year. Based on these indicators, the fear that was present in February is fading, and while optimism has ticked higher, it has not reached excessive levels just yet.
But if we pay less attention to how investors say they feel and instead focus on how they are allocated, a different picture emerges. This data on household asset allocation comes from a quarterly report from the Fed and it might be the single chart that I spend the most time considering. Even given the delayed release in this data, the message seems inconsistent with the weekly flow data above. Outflows from equity funds in 2000 and 2009 were accompanied by a big up-tick in cash. That has not been the case recently. And if outflows are not resulting in a lot of cash on the sidelines, the potentially bullish message from outflows would seem to be muted. Relative to history, households have too much equity exposure and not enough cash.
continue reading on the next page…

