Key Takeaways:
1). After a robust rally to begin the year, stocks are now in the midst of their most significant pullback of 2019.
2). Continued strength from leading groups (like Semiconductors) and evidence of a quick shift in investor sentiment would be consistent with a consolidation that is limited in degree and duration.
3). Further deterioration in sector-level trends and other breadth indicators coupled with persistent optimism would raise the risk of a more meaningful correction.
The S&P 500 is less than 3% below the record high reached last week. While not much of pullback from a historical perspective, it is nonetheless the most significant period of weakness seen so far this year.
News headlines about the prospects for a trade deal with China could keep near-term noise elevated. Whether this pullback is limited to period of consolidation or deteriorates into a more meaningful correction remains an uncertainty for now.
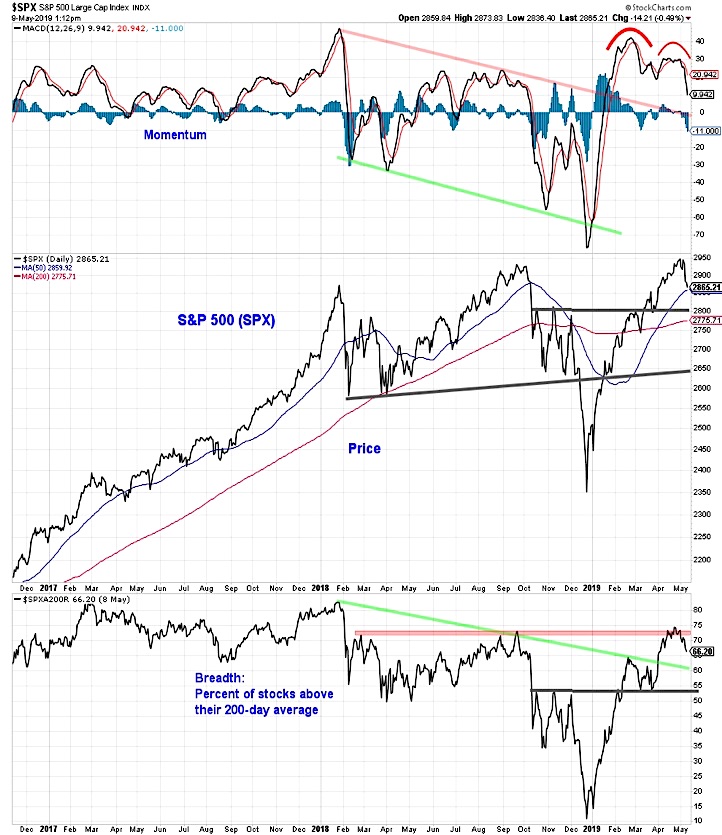
The behavior of the broad market and potential shifts in investor sentiment will likely provide evidence that one scenario is becoming more likely than the other. From the perspective of the S&P 500, momentum and breadth have already weakened more significantly than price. Momentum has made a lower high and lower low since peaking in February.
From a breadth perspective, the percentage of stocks trading above their 200-day averages is retreating after it failed to meaningfully breakout above its February/September 2018 peaks and confirms the recent price highs.

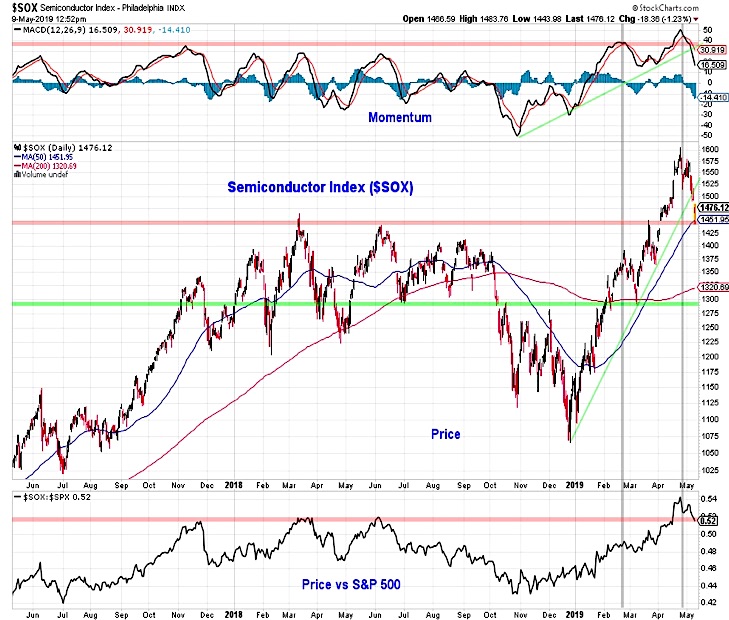
While the deterioration in the S&P 500 is worth watching, it is not likely to accelerate lower by itself. The semiconductor index (SOX) deteriorated ahead of the S&P 500 last summer and led way higher off of the late-year lows. If the SOX can find support near last month’s breakout levels (on both an absolute and relative price basis), weakness on the S&P 500 may be limited.
Momentum on the SOX, however, is faltering and the trend off of the 2018 lows has been broken. Likewise, evidence of renewed leadership from small-caps could also bolster the overall stock market. Small-caps have lagged large-caps on a relative basis and the ratio between the Russell 2000 and the S&P 500 has pulled back to long-term (multi-year) support.

We can gauge market breadth across indexes, and also look at it within indexes. If the percentage of stocks trading above their 200-day average (shown on the first page) dips below 55% it would signal a meaningful deterioration. Likewise, a continued expansion in the new low lists (the number of new lows on the NYSE moved to a new 2019 high today) after a failure of the daily new high list to expand would also be a negative.
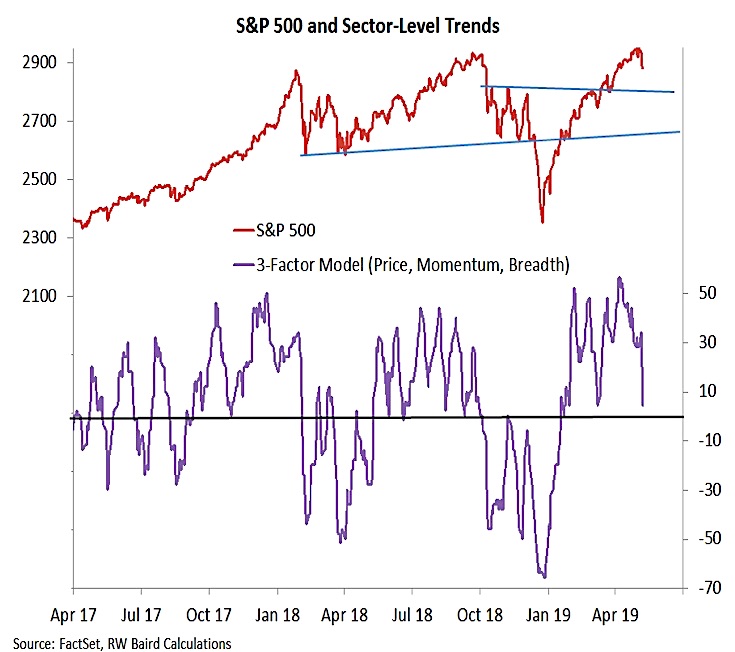
Shorter term, sector-level price, momentum, and breadth trends have already seen a notable weakening. Further deterioration form here would increase the risk that the current index-level pullback is not likely to be limited to a brief period of consolidation.

In addition to developments in our breadth indicators, we also want to keep close tabs on investor sentiment. Coming into this week sentiment gauges were showing evidence that excessive optimism was emerging, and equity funds were starting to see inflows for only the second time this year. In the context of trade deal related news, the absence of a deal could help push sentiment into the extreme pessimism mode as measured by the NDR trading sentiment composite.
On the other hand, news that a deal is in the works could keep investors relatively optimistic, and prolong the sentiment re-set that appears to be necessary as this point.
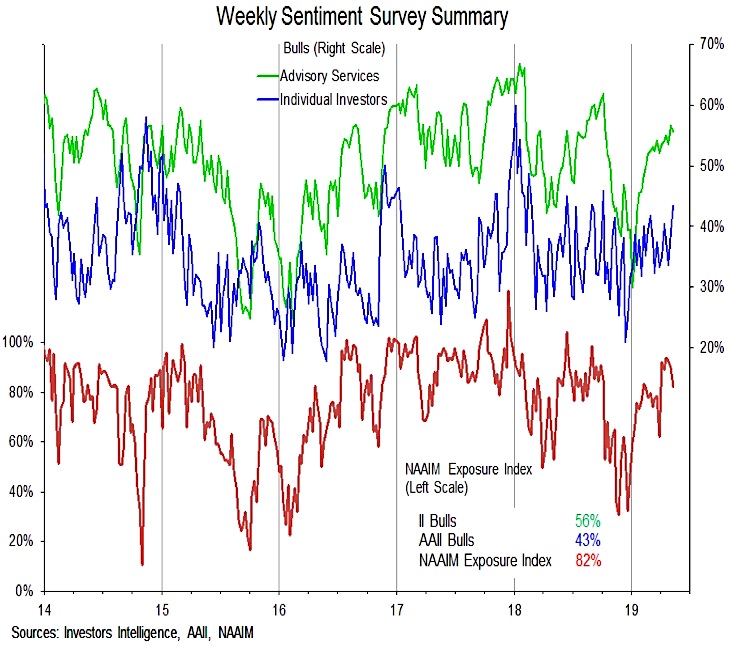
While shorter-term measures of sentiment (like the Trading Sentiment Composite) have shown some evidence of shifting attitudes, the weekly sentiment surveys have been slower to react. The II survey still shows 55% bulls, though most of these opinions were likely formed and expressed prior to this week’s headlines and market reactions.
More surprising, the AAII data showed more optimism this week, with bulls rising to their highest level since October. The NAAIM exposure index ticked lower (from 90% to 82%). The distribution details show that while the bearish extreme turned more cautious, many manager maintained elevated exposure to equities or even increased it. Persistent optimism at this point is a risk/headwind for stocks.

Twitter: @WillieDelwiche
Any opinions expressed herein are solely those of the author, and do not in any way represent the views or opinions of any other person or entity.


