The Federal Reserve has announced it will continue with its tapering plan.
However, the Fed will decrease bond-buying by 10 billion per month instead of the previously stated 15 billion.
As of now, the program is set to buy 120 billion in bonds per month. This dovish sign creates an easier environment for the economy and stock market to ease off the Federal Reserve’s support.
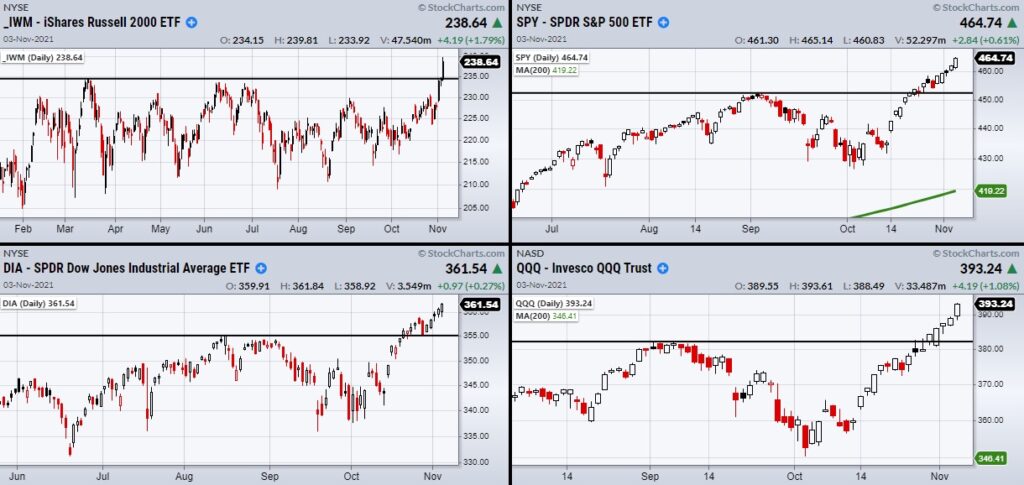
After the announcement, the four major stock market indices rallied into the market close venturing further into new high territory.
With that said, what key levels should investors look for next as they buy or take profits based on the recent break to new highs?
One thing investor’s should always keep in mind is their risk tolerance. When trading you always need a cutoff level of where you will get out no matter what happens to your trade or investment.
In the case of our current rally, the obvious cutoff level for anyone trading the major stock indices is the recent breakout point.
As seen in the daily charts above, the black lines show the levels where the index cleared to new highs. This is the area each index should hold if the market is going to keep its upward momentum. Though breakout areas are often revisited, ultimately price should bounce back as new buyers hold the line.
Even if you are not trading the major indices, watch these levels as you want the general market on your side when buying new long setups.
Now that the Fed has shown their tapering policy is more friendly than investors expected, the next focus will likely turn to inflation.
Nonetheless, for the moment, watch for the current break to hold as the Fed has more time to focus on inflation and rising interest rates in the coming year.
Stock Market ETFs Trading Analysis:
S&P 500 (SPY) 454 is price support.
Russell 2000 (IWM) 234.53 is price support.
Dow Jones Industrials (DIA) 356.60 is price support.
Nasdaq (QQQ) 382.78 is price support.
KRE (Regional Banks) 72.90 is price support.
SMH (Semiconductors) 277 is price support.
IYT (Transportation) 280 is price resistance.
IBB (Biotechnology) Watching to clear the 50-day moving average at 164.82
XRT (Retail) 98 is price support.
Twitter: @marketminute
The author may have a position in mentioned securities at the time of publication. Any opinions expressed herein are solely those of the author and do not represent the views or opinions of any other person or entity.


