The Index Futures Market – Big Picture
I think it’s helpful to go back over the prior week of trading action and review the setups that occurred. Sometimes taking a step back allows traders to see the market in slow motion and better understand where stocks may be headed (and stock market futures).
I think this also allows for higher probability trading setups because we have a better overall idea of market structure and trend. Your patience and discipline as a trader will continue to grow when you implement such practices.
Okay, let’s start the review what happened and finish with a look ahead on key stock market futures indices.
Stock Market Futures: Looking At The Week Behind
Two months down. Ten more to go. Not sure I can take anymore of this uncertainty.
Just kidding. This is the stock market. It’s all about uncertainty which makes it an adventure each day. Oh what an adventure it has been. Sell of January into rally February which has made the end of the month a questionable window dressing as we approach contract expiration or are things actually looking up?
In the end it doesn’t matter what I think or for that matter what anyone thinks. The bottom line is trading the charts in front of you for an intraday trader and being on the side with the highest probability of the setup continuing in TREND. To that fact, I was put to the test almost each session this last week on the ES.
With the Sunday open gaping up significantly on all 4 indices, , the chase was on to break through upside and go grab the 50 and 200 moving averages or turn south and close out the gaping wounds left from the previous Fridays close. The ultimate test was siting through and with much patience, waiting for the setup that would run. Which one would it be? Only and only when the charts lined up, would I enter. Where there setups that caught me? Sure! Where there setups were I was so set that price action would run? Sure. did they all work out? Nope. However the ones that did, paid off substantially in ticks and as a trend trader, regardless of which indicator you use to identify a strong trend, would have kept you in.
Stock Market Futures: Looking At The Week Ahead
Decision time.
With end of the month trading, contract rollover, price at key moving averages, open gaps above and below, FOMC meeting approaching….and the list goes on. Can make your spin head that you may never take an entry and that is why I leave it to the 50/144ema chart to guide me in the TREND on any chart on an intraday basis, regardless of the bigger picture. I could tell you that the market will be going up this week and I have a 50/50 chance of being right. Sounds like any guru out there. So….remember to leave your bias at the door and trade the charts in front of you and watch for key momentum levels. Overall technical momentum leading into the week is Bullish with support below to watch for @ the 50ema’s on the 4 hour 50/144ema charts.
Technical Bias & Charts leading into the first week of March
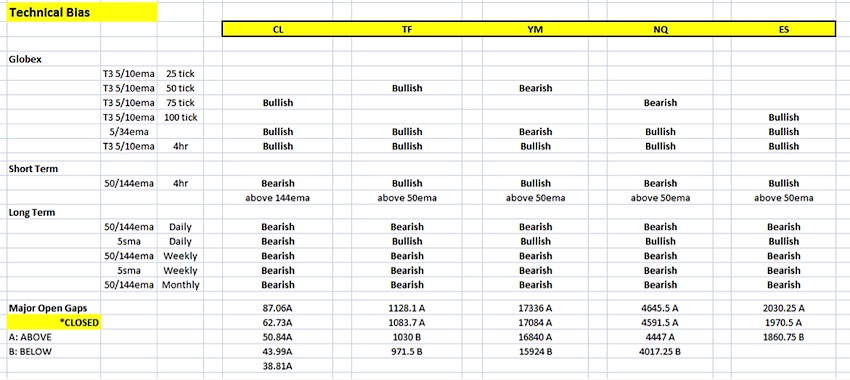
“Big Picture” Charts as of market close Friday 2.26.16
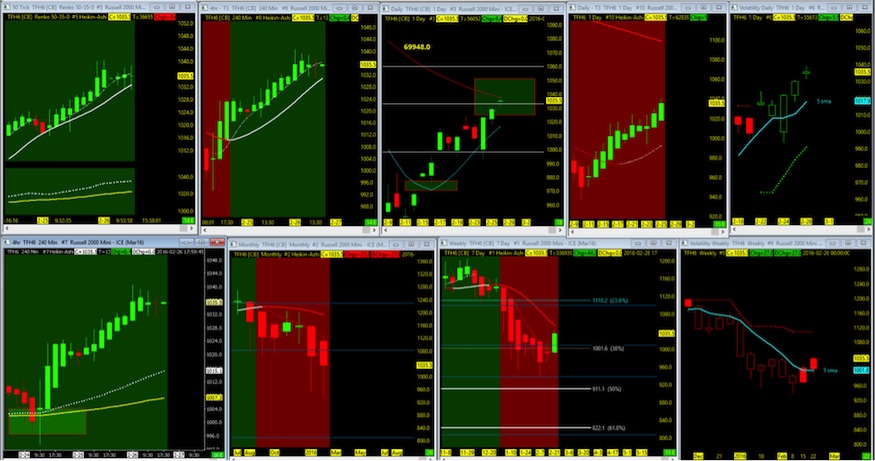
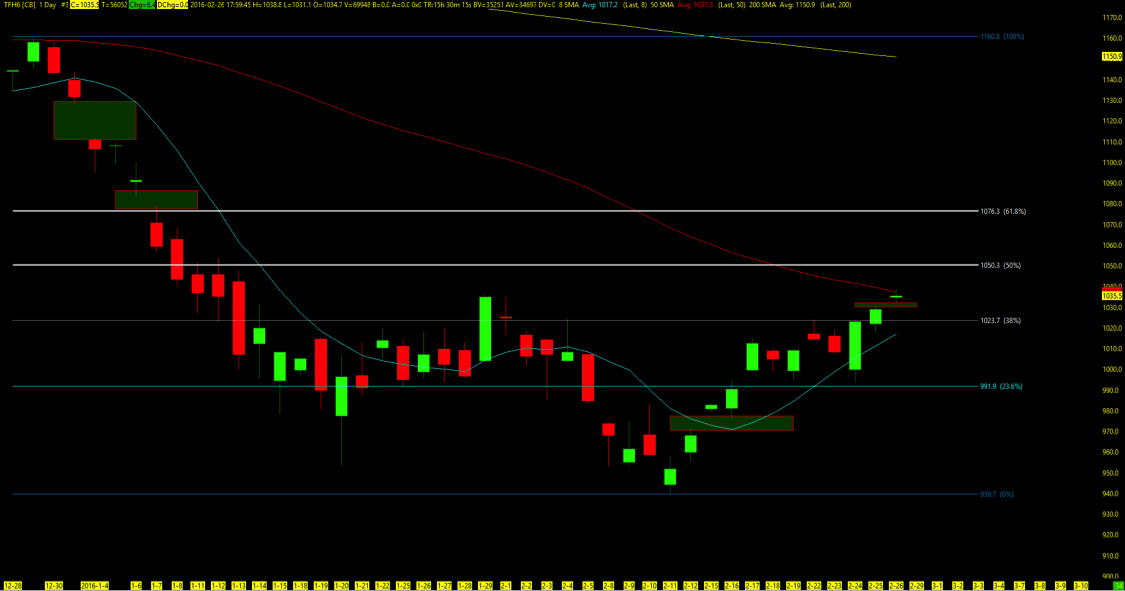
Russell 2000 Futures (TF)
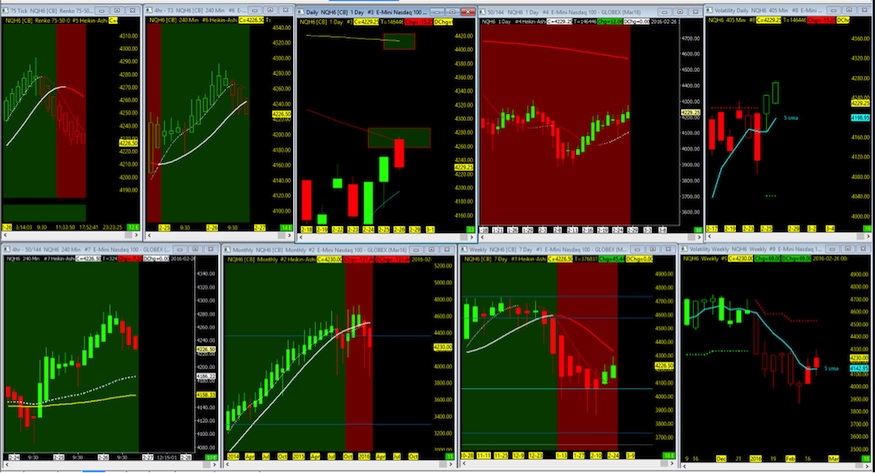
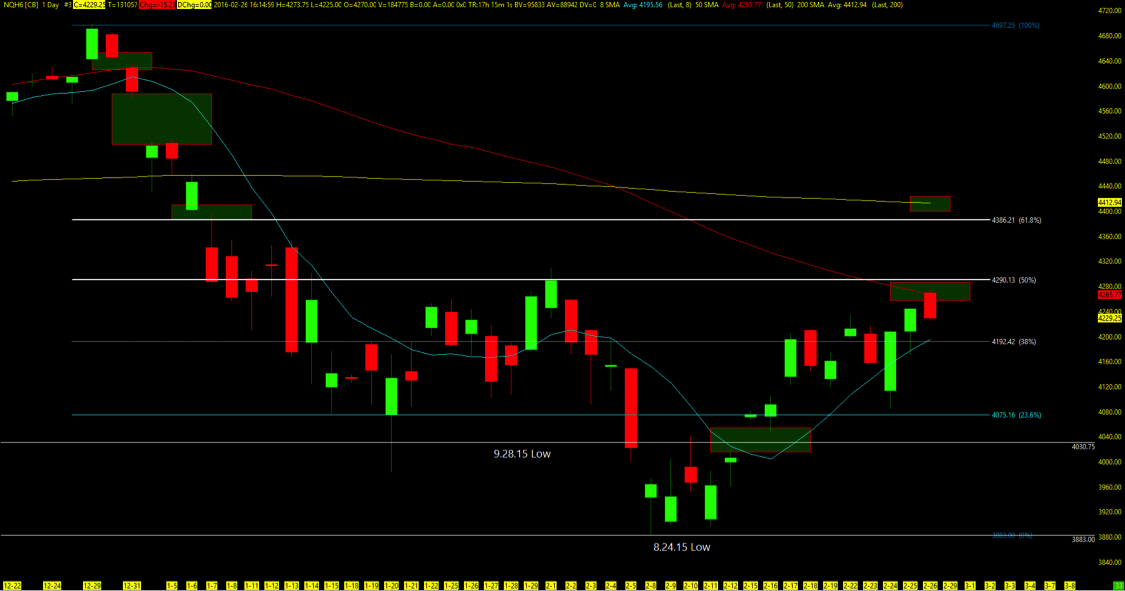
Nasdaq Futures (NQ)
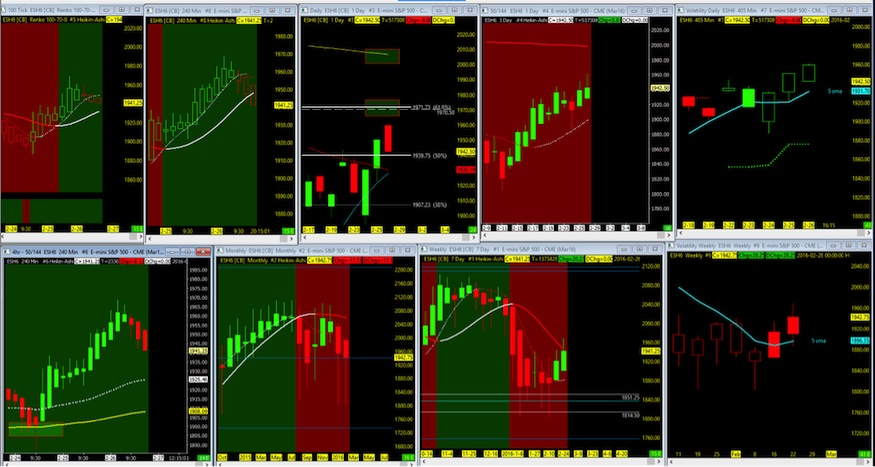
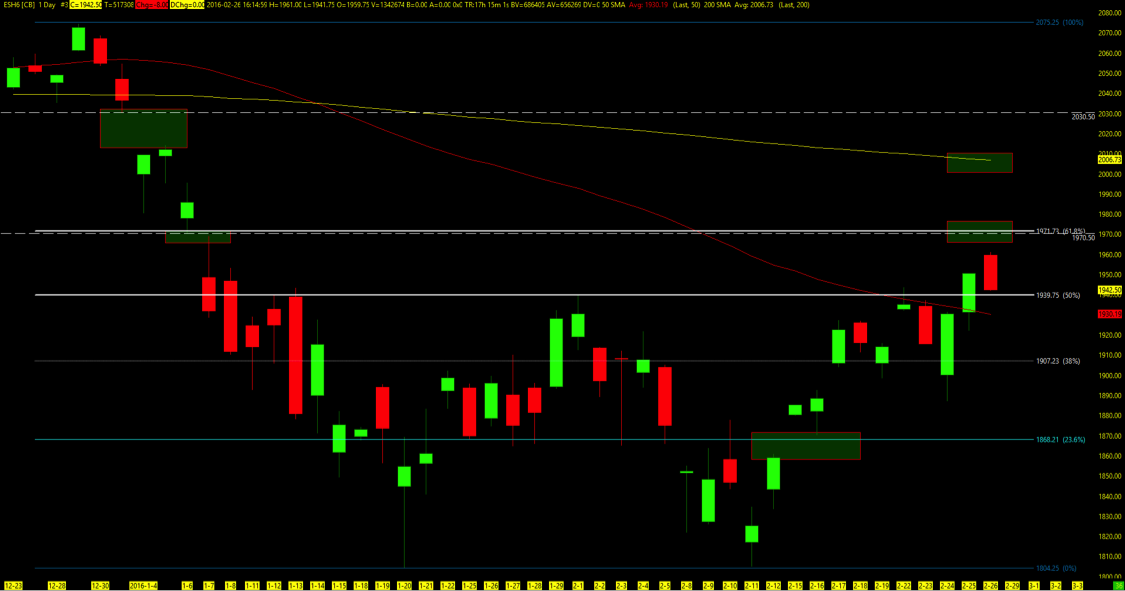
S&P 500 Futures (ES)
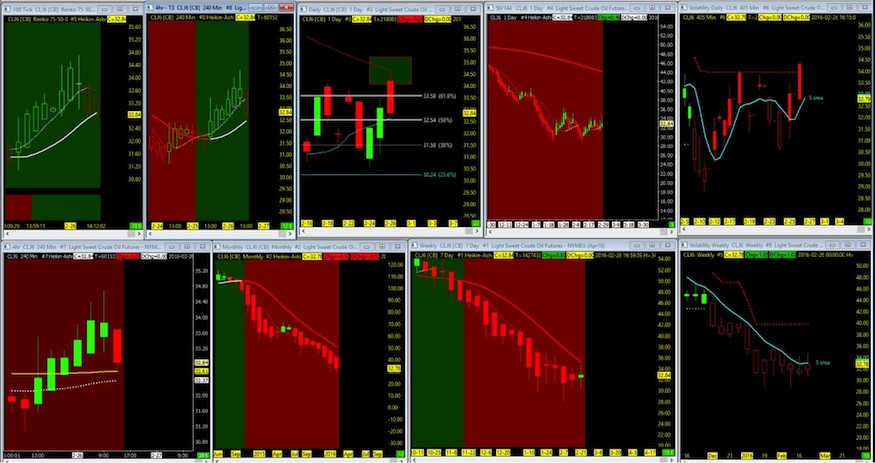
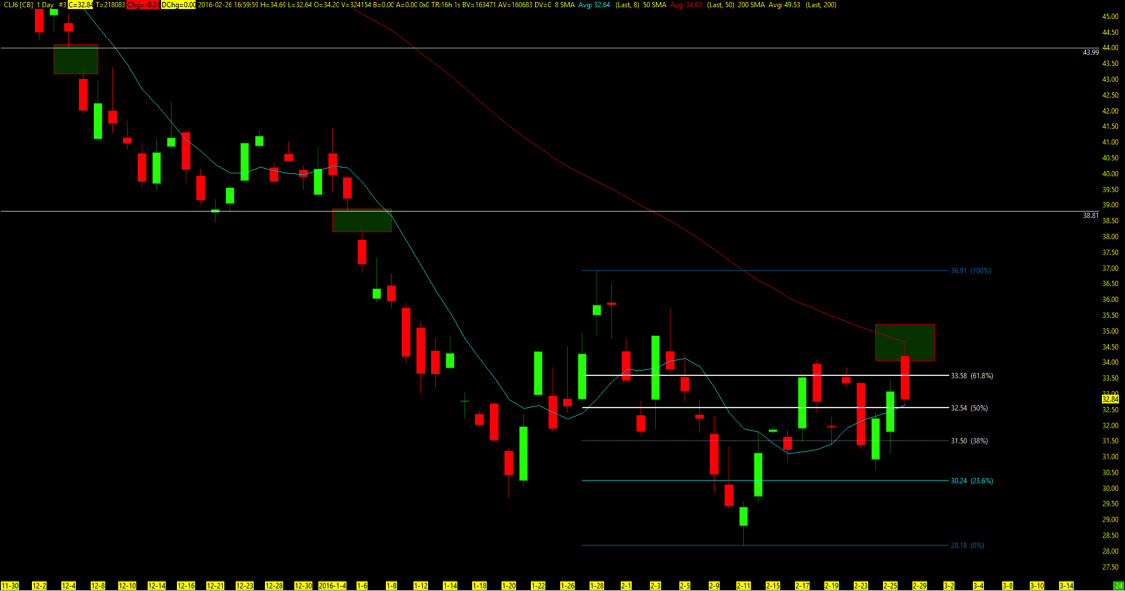
Crude Oil Futures (CL)
Crude closing out the open gap at 33.74 and now at the 50ema, still remains in a technical bearish trend on the big picture . Talking of production cuts continues to move the market in violent swings in price. Price crossing over the 50/144ema with the trend still in the RED will be the key chart I will watch to see if there is any hope of upside momentum. Open gaps remain above at 36.71 and 48.74 will be in my scopes.
Combined with fundamentals and what you believe to be a price of value based on your own criteria, watch for at least the technical cross of the T3 moving averages on a higher time frame and the four hour chart to put you in good position. While I do not look for intraday setups, using the T3 strategy is useful as a trading tool in looking for momentum in price action and remaining in the trend. Whether you go short or long in the market, wait for the highest probability when ALL charts are in sync.
Until then, always ready in both directions. Thanks for reading and have a great week.
Twitter: @TradingFibz
The author trades futures intraday and may have a position in the mentioned securities at the time of publication. Any opinions expressed herein are solely those of the author, and do not in any way represent the views or opinions of any other person or entity.
: Creating Bullish Divergence?")


 and Semiconductors (SMH): Concerning Price Pattern?")


