THE BIG PICTURE
The VIX Volatility (INDEXCBOE:VIX) continues to trade below 10 as we head into week 29. Market history raises claim to such low levels as caution for the S&P 500 (INDEXSP:.INX) to retreat however it’s been wavering at these lows for weeks… and doesn’t seem to have spooked the market for any significant pullback just yet.
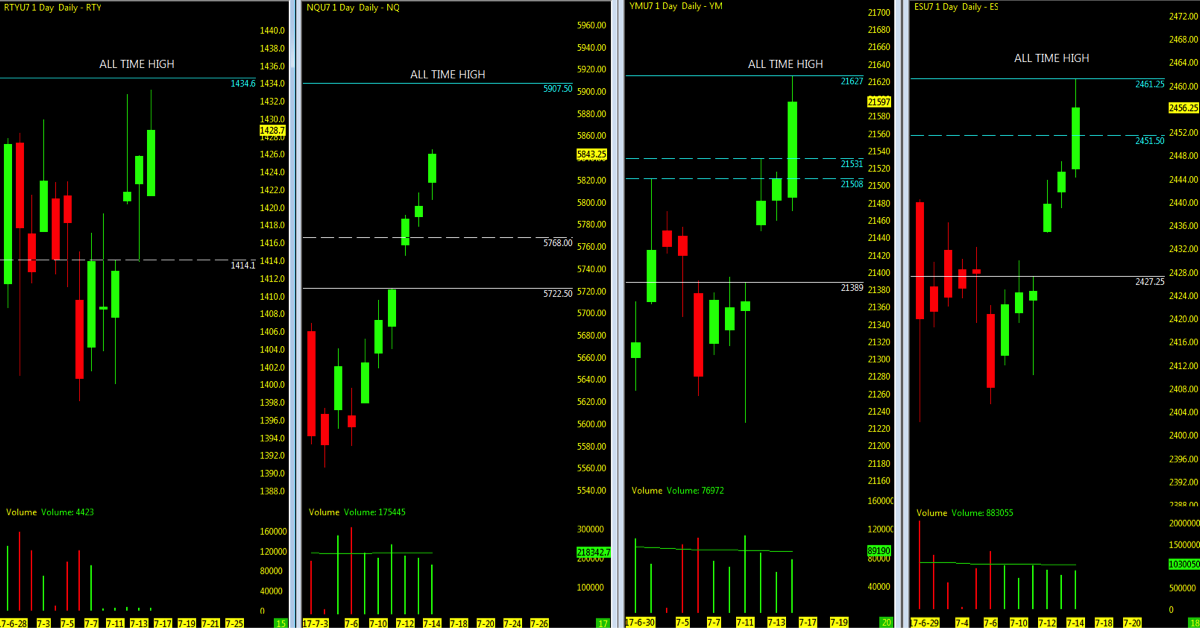
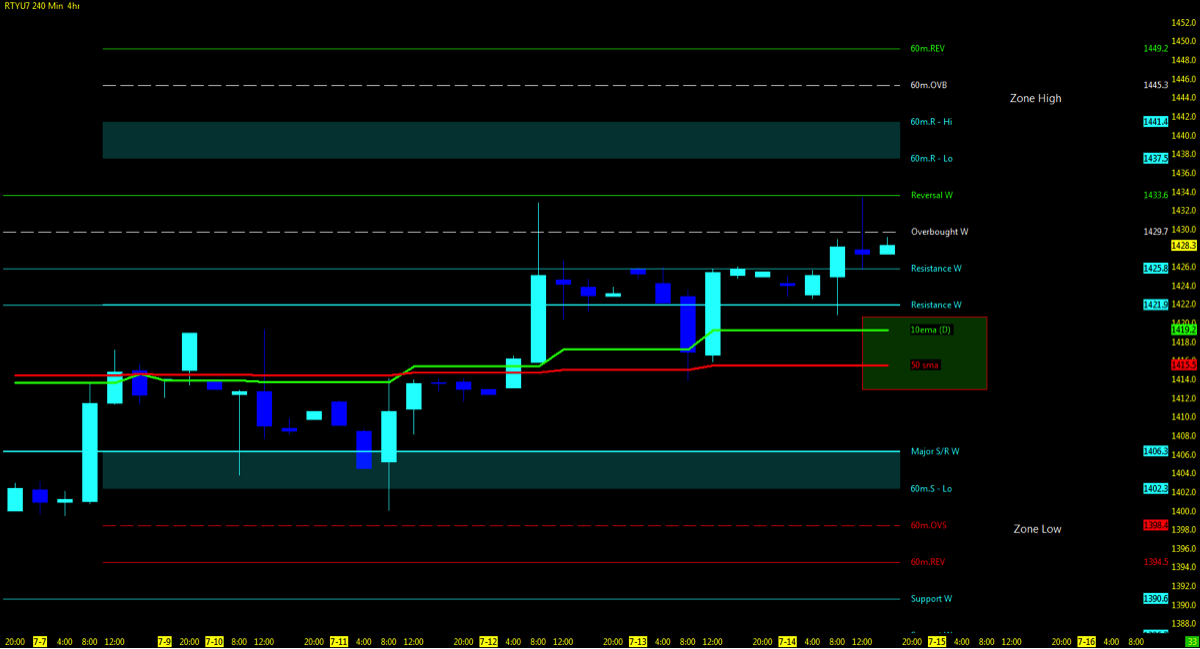
The Russell 2000 is showing superb intraday trend as the matching Russell 2000 Futures (TF) and other indices have moved upside. Though the volume is not a match, a solid start for this new listing. Summertime momentum continues at it’s best in the AM morning session as we now roll into earnings season after financials started to report on Friday. Permabears haven’t given up yet.
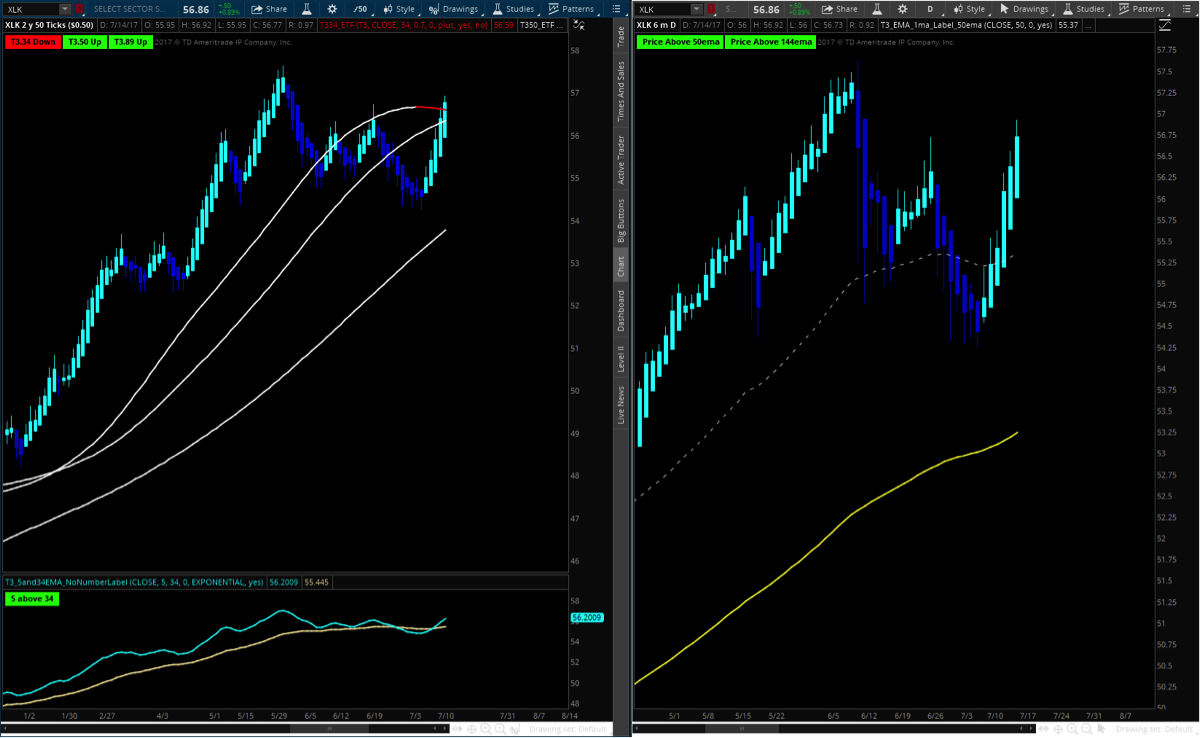
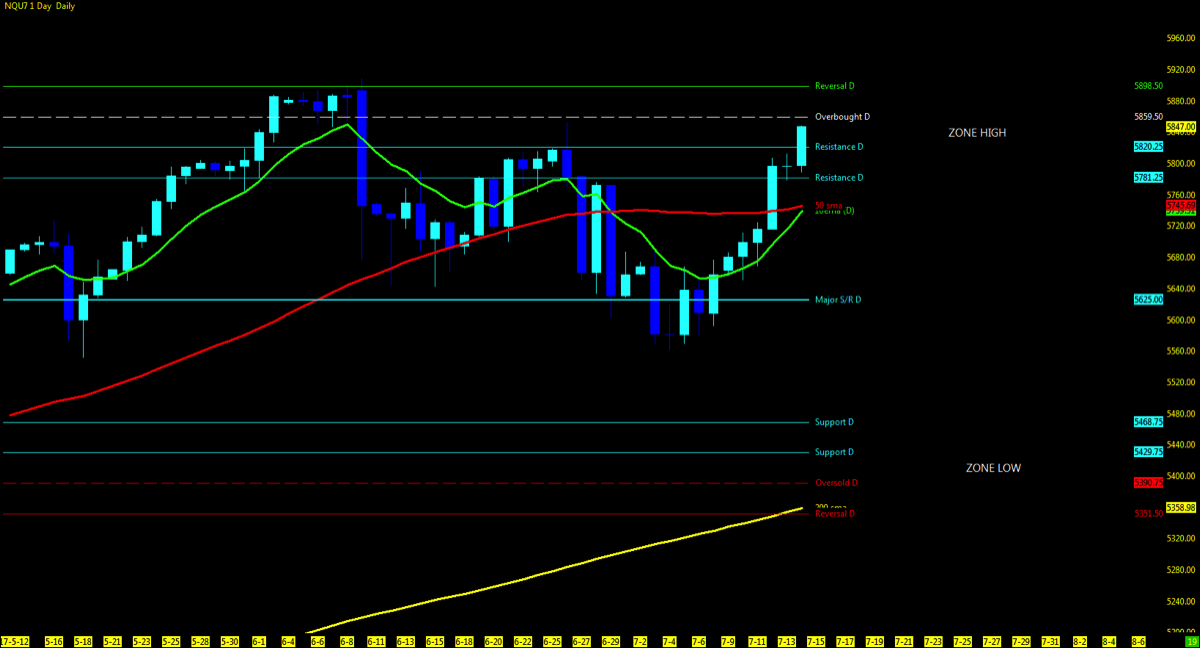
FANG/FAAMG stocks rebounding with the NQ pursuing its chase back up to the all time highs after a gap up. Monitor the next several weeks as earnings should play out the bigger picture and give cause to warrant the higher valuation in the market on the tech sector (NYSEARCA:XLK).
Technically by the charts, the indices (YM/ES/NQ) open gaps from week 28 are the first targets downside on any pullback.
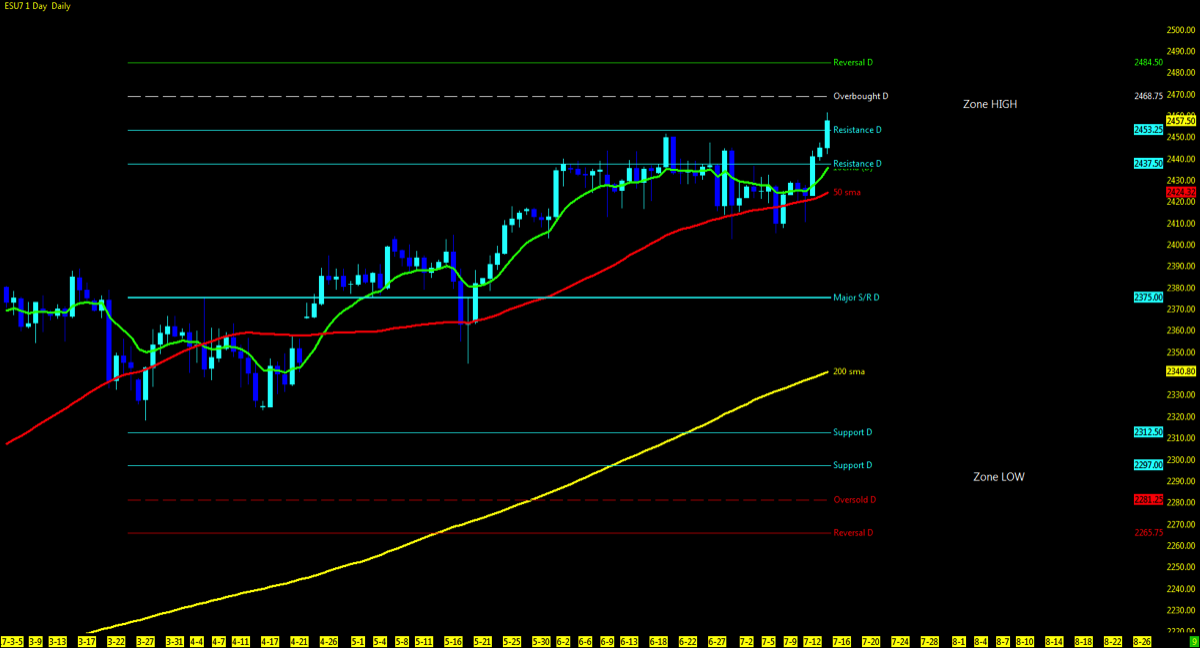
I’m watching for any pullback to test support off the nearby 10 and 50 period moving averages. With the surge back above the 10 day ema and two new all time highs made on the Dow Jones Futures (YM) and S&P 500 futures (ES), evidence of weakness has taken as back seat again. As always be ready for both directions in an unpredictable market.
Key events in the market this week are on the lighter side with the Philly Fed and economic earnings starting to roll out.
Technical momentum probability REMAINS in a UPTREND on the bigger pic as we hold above the key moving averages. As always, BEWARE of the catalyst wrench (Washington Politics) that looms overhead of if and when the market may sell off in reaction to unsettling news.
THE BOTTOM LINE
With all indices now above key moving averages, back within all time highs and a low VIX, monitoring for any pullback to the open gaps and or nearby 10/50 moving averages to the downside would be prudent. The case for higher highs is just as strong and whether you trade the intraday futures or indices ETF’s, momentum clearly resting on the uptrend is a much stronger play.
Swing ETF positions should be careful about chasing at the highs as pullbacks are always opportune times to re-enter the trend. The Dow Jones ETF (DIA) is currently showing the strongest trend of all four indices.
Nasdaq Futures (NQ)
Technical Momentum: UPTREND
Using the Murray Math Level (MML) charts on higher time frames can be a useful market internal tool as price action moves amongst fractal levels from hourly to daily charts. Confluence of levels may be levels of support/resistance or opportunities for a breakout move.
Multiple MML Overlay (DAILY )
- Lowest Open Gap: 4017
S&P 500 Futures (ES)
Technical Momentum: UPTREND
Multiple MML Overlay (DAILY )
- Lowest Open Gap: 1860.75
Russell 2000 Futures (CME)
Technical Momentum: UPTREND Consolidation
Multiple MML Overlay (RANGE)
- Lowest Open Gap: NONE
Attempting to determine which way a market will go on any given day is merely a guess in which some will get it right and some will get it wrong. Being prepared in either direction intraday for the strongest probable trend is by plotting your longer term charts and utilizing an indicator of choice on the lower time frame to identify the setup and remaining in the trade that much longer. Any chart posted here is merely a snapshot of current technical momentum and not indicative of where price may lead forward.
Thanks for reading and remember to always use a stop at/around key technical trend levels.
Twitter: @TradingFibz
The author trades futures intraday and may have a position in the mentioned securities at the time of publication. Any opinions expressed herein are solely those of the author, and do not in any way represent the views or opinions of any other person or entity.

