Stock Market Futures Considerations For December 1, 2017
The S&P 500 (INDEXSP:.INX) and Nasdaq (INDEXNASDAQ:.IXIC) are showing very different formations (and performance) of late. I break down both futures indices along with crude oil in my trading commentary below.
Note that you can access today’s economic calendar with a full rundown of releases.
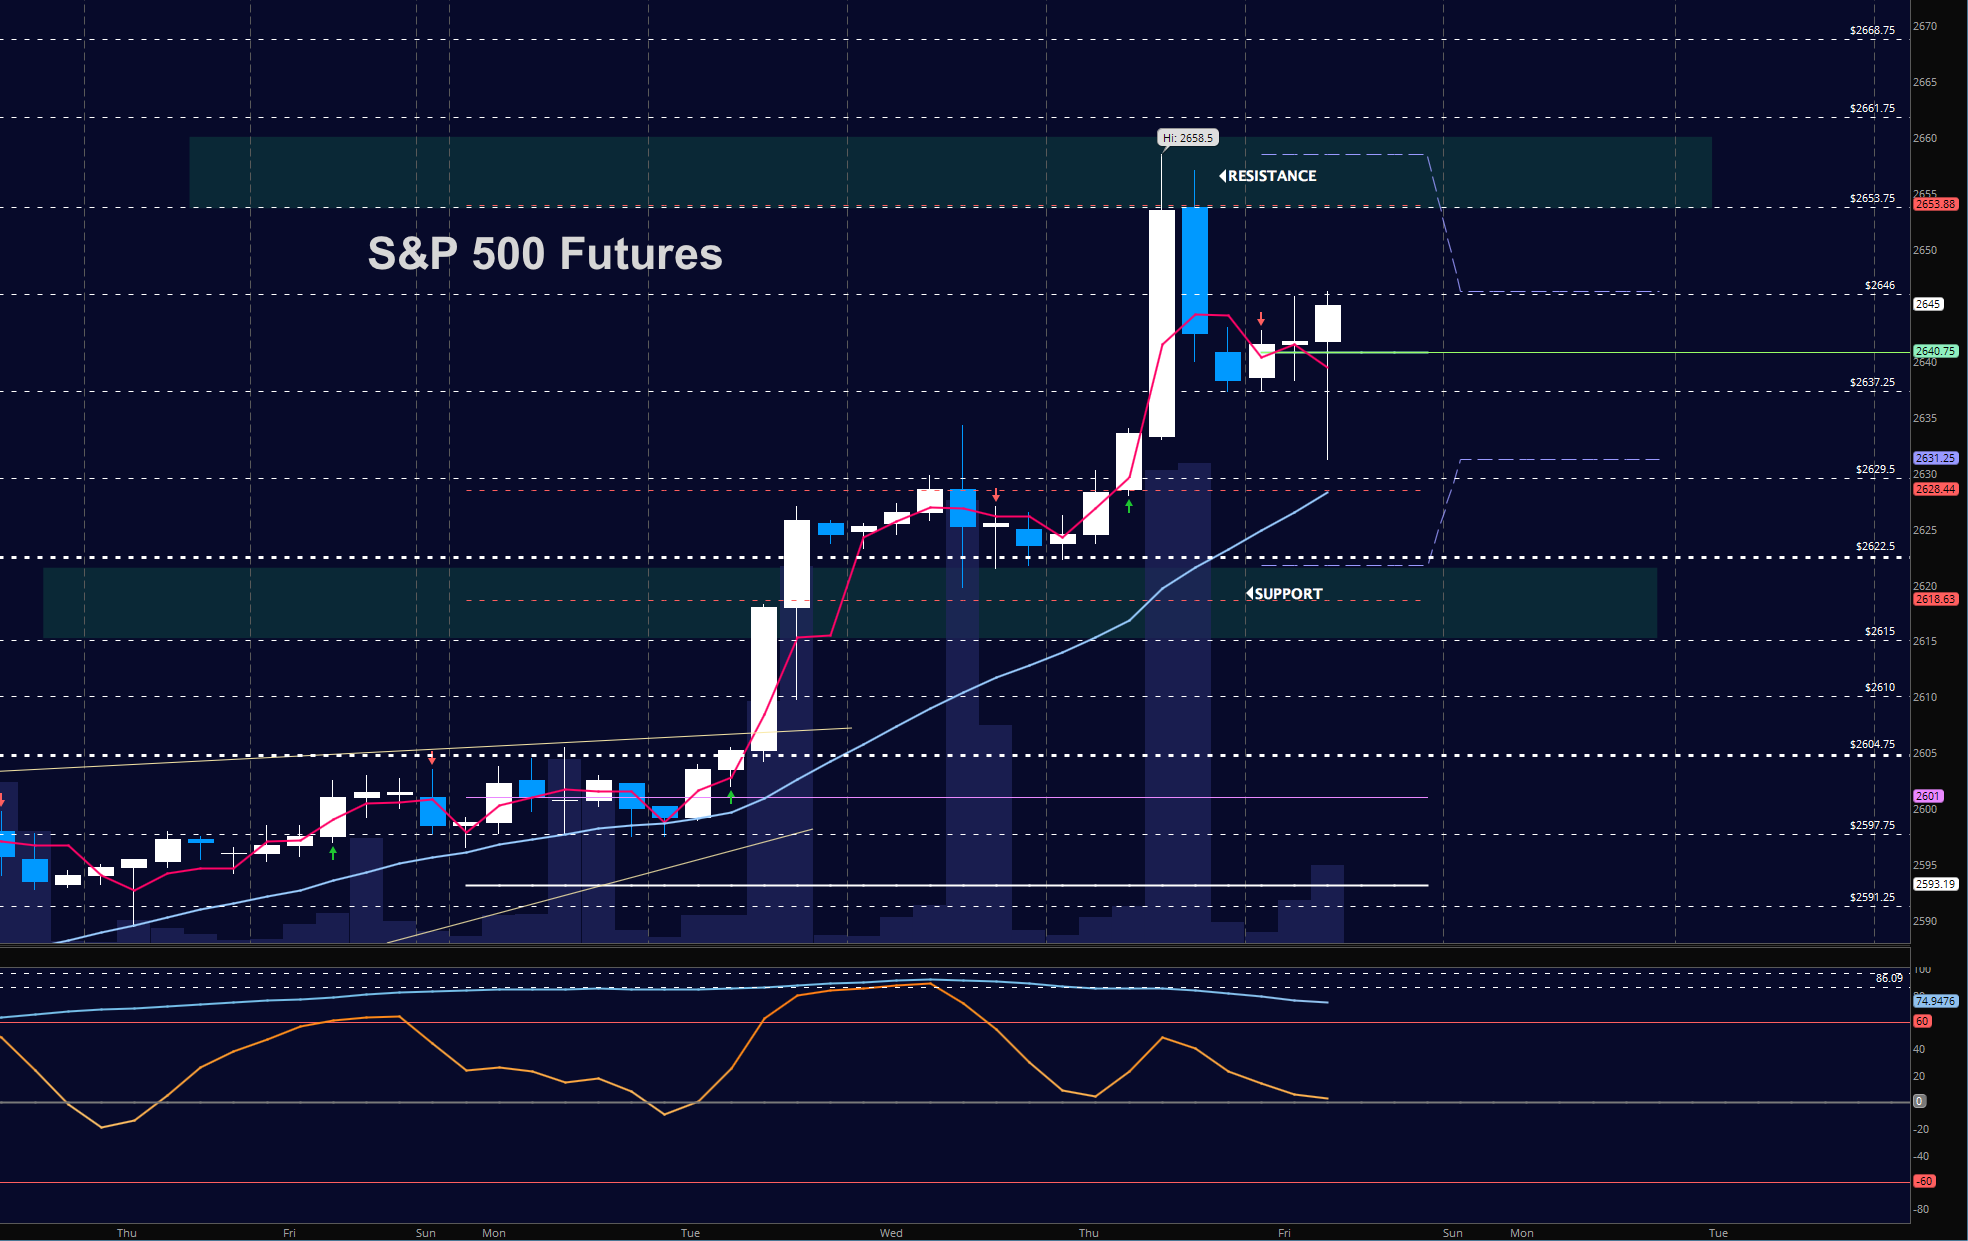
S&P 500 Futures
Range expansions show breakouts continuing as a premarket test of the breakout level near 2632. Buying breakouts and holding strategies seem to be an unreasonable approach here for intraday play. Instead, watching for the test of support to engage in long positions is a better plan as it will diminish risk. We should continue to fade off new highs. As long as new support holds near 2631, we should have bullish action continue overall. Below 2622, intraday strength could shift into bearish formations, but not before buyers fail to hold the likely bounce. The bullets below represent the likely shift of trading momentum at the positive or failed retests at the levels noted.
- Buying pressure intraday will likely strengthen above a positive retest of 2646.5
- Selling pressure intraday will likely strengthen with a failed retest of 2637.5
- Resistance sits near 2646.5 to 2653.5, with 2658.5 and 2662.25 above that.
- Support holds between 2637.5 and 2632, with 2622.5 and 2610.5 below that.
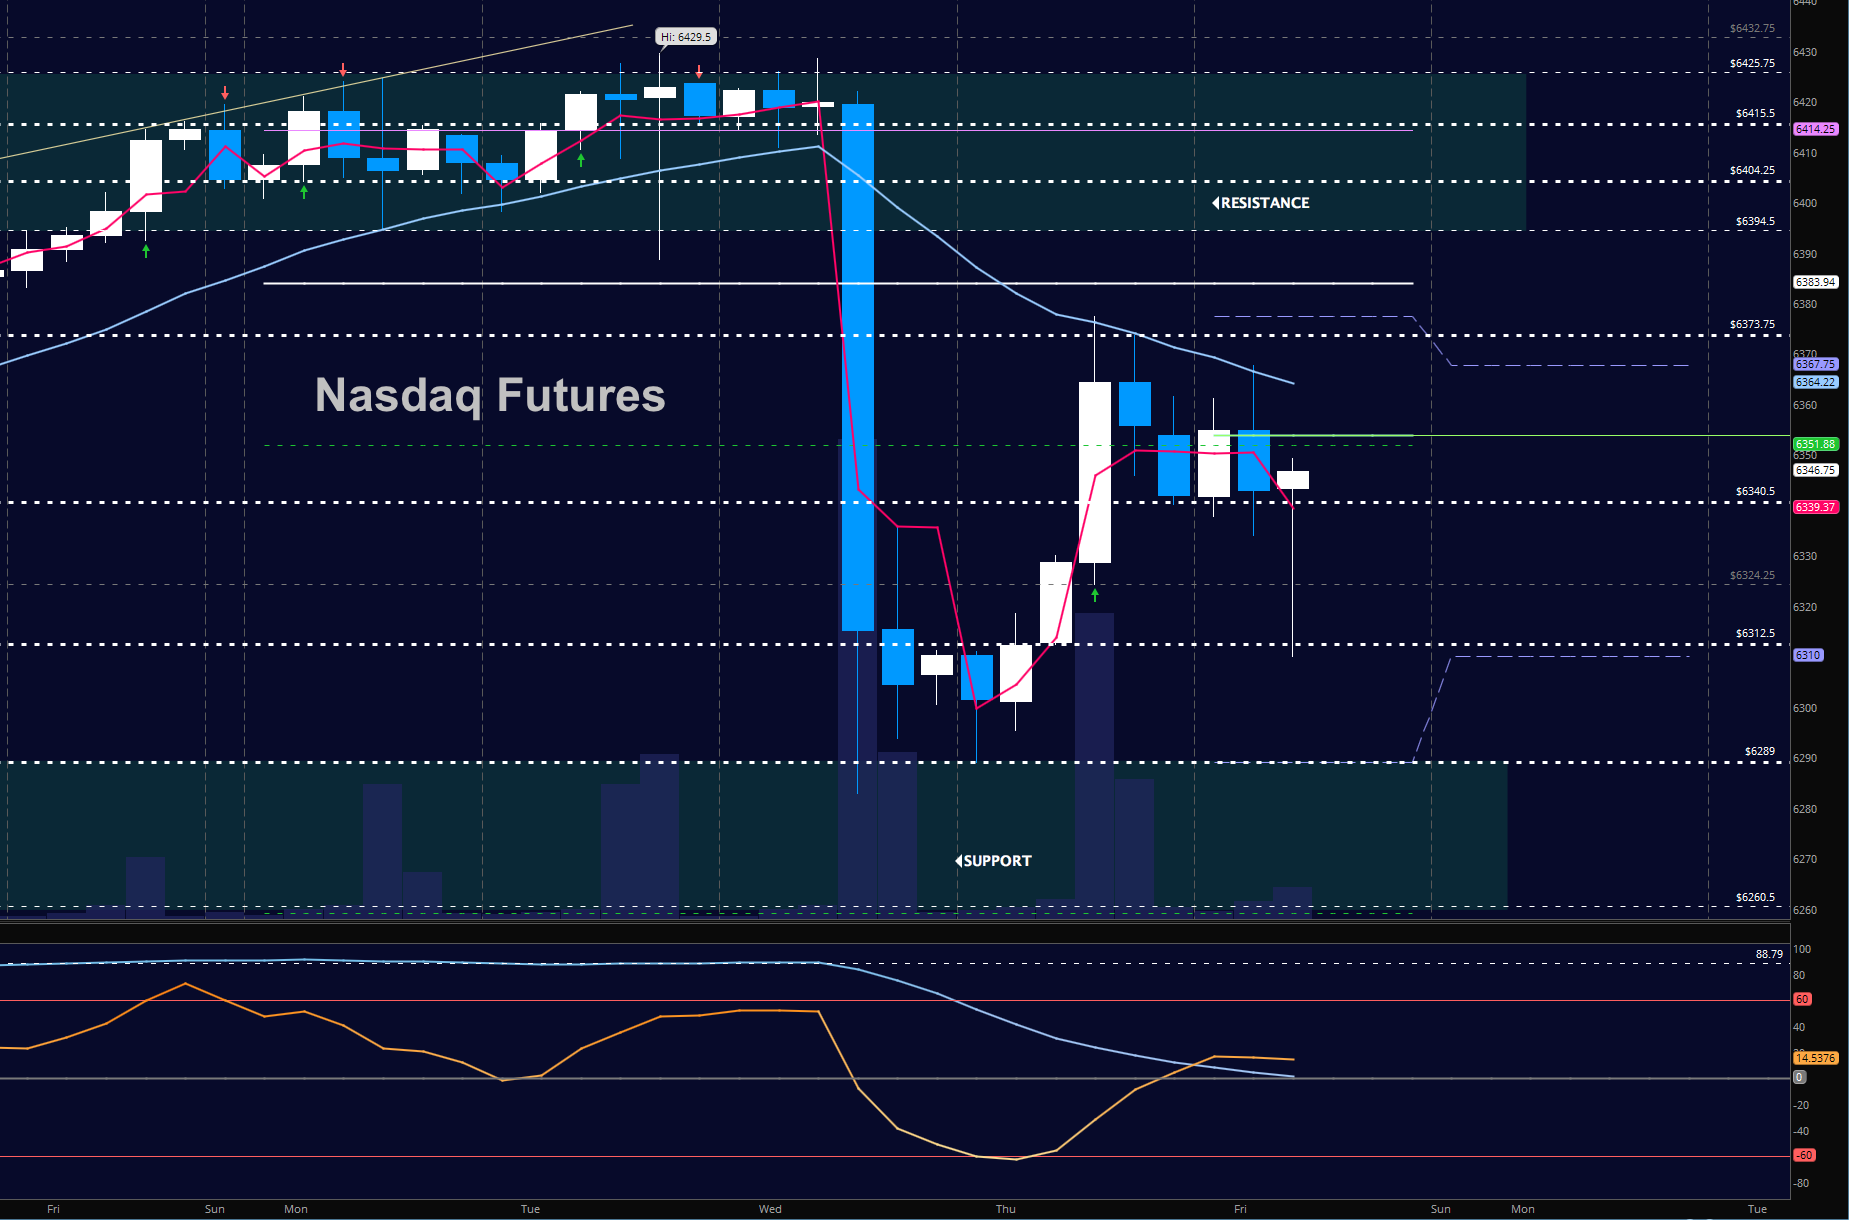
NASDAQ Futures
In the current sector rotation event, we see tech failing to press higher on the move to financials. Bullish undercurrents are weakening. Support tests near 6300 will tell the tail as well as a failure to return to highs above 6374. Patience is required to avoid the most risk. The bullets below represent the likely shift of intraday trading momentum at the positive or failed tests at the levels noted –
- Buying pressure intraday will likely strengthen with a positive retest of 6374.75
- Selling pressure intraday will likely strengthen with a failed retest of 6329.5
- Resistance sits near 6352.75 to 6367.5 with 6384.5 and 6394.5 above that.
- Support holds near 6332.5 and 6310.75, with 6289.25 and 6263.75 below that.
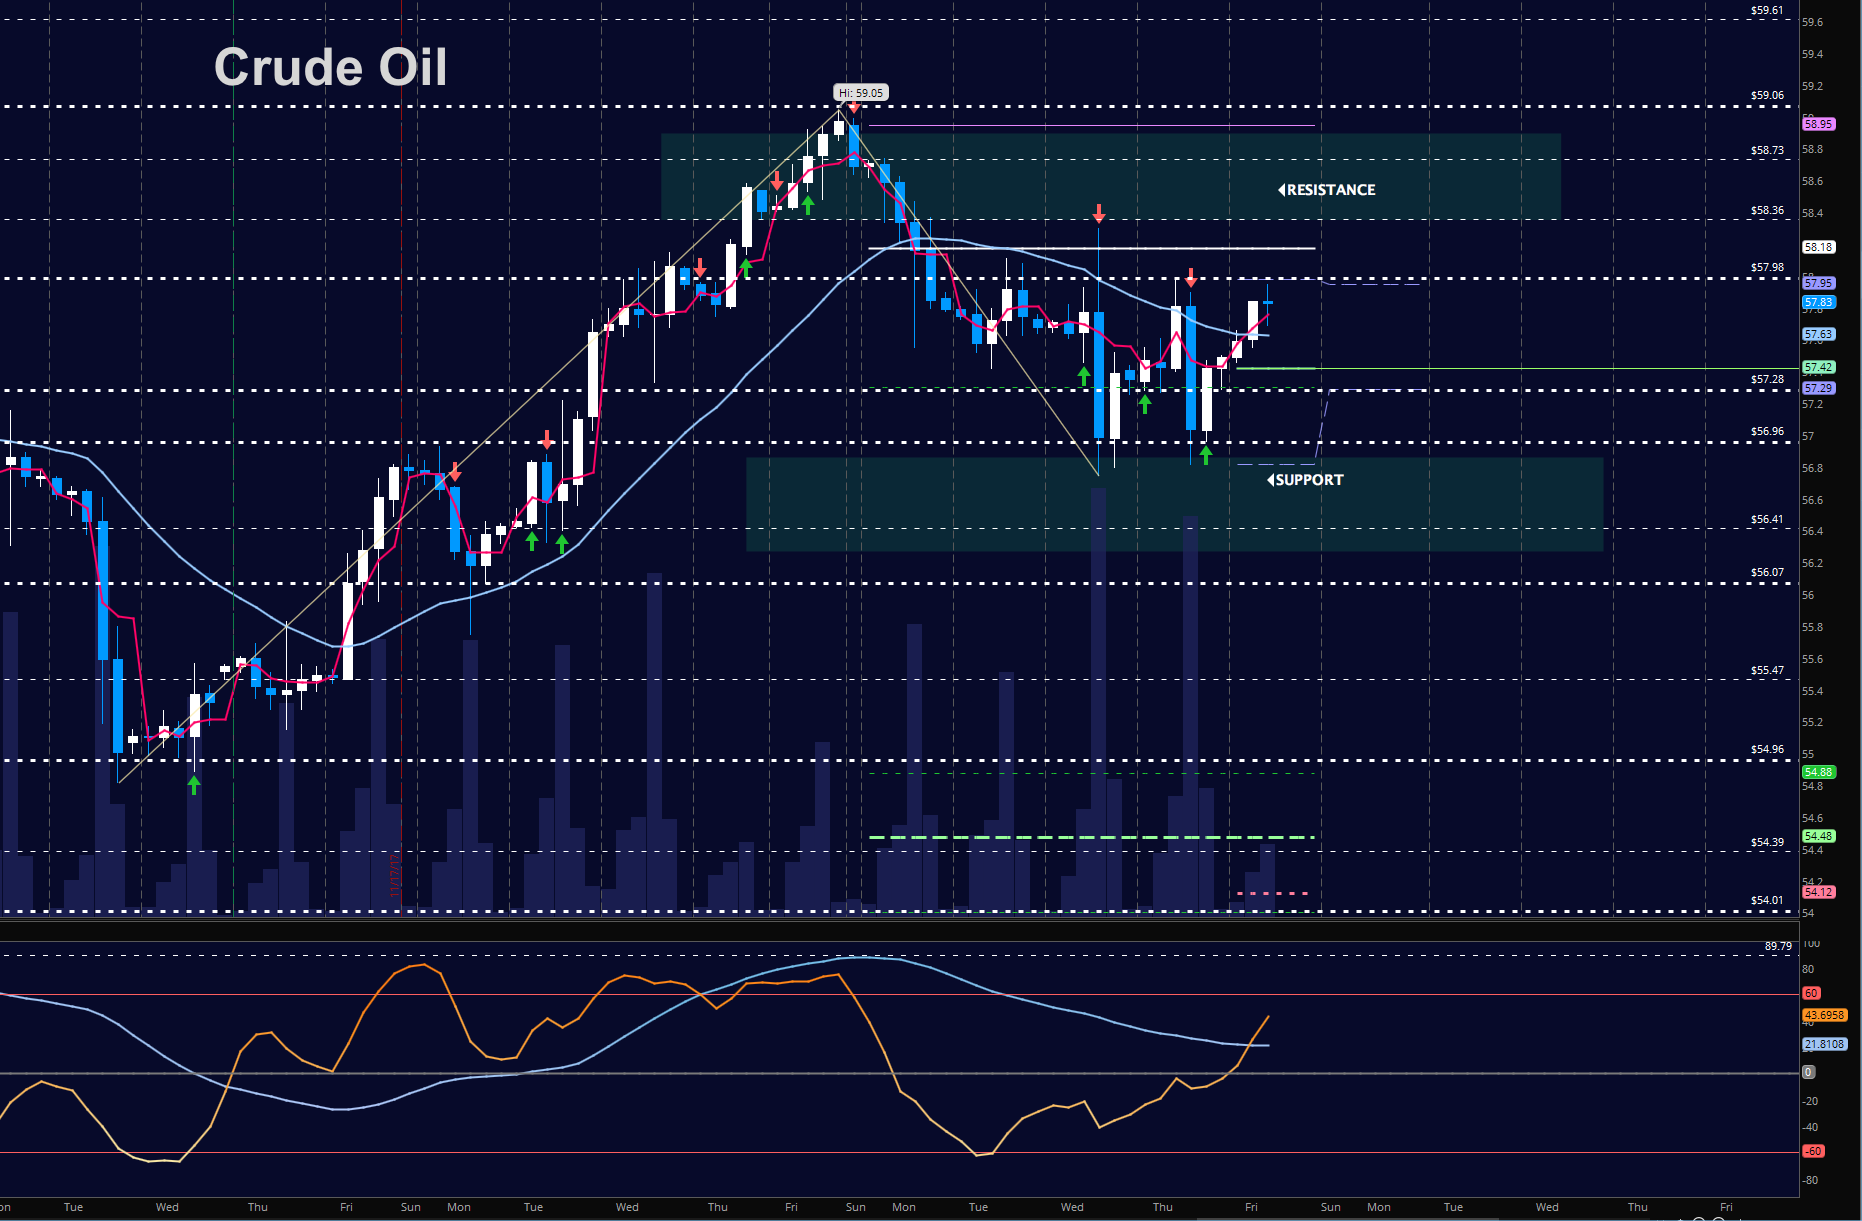
WTI Crude Oil
A 50% Fibonacci retrace of the last wave brought us to support near 56.98 that held after a retest. We should resume the move upward, with a support that needs to hold near 57 to keep the premise of further upside intact. The bigger undercurrent is still bullish. The bullets below represent the likely shift of trading momentum at the positive or failed tests at the levels noted.
- Buying pressure intraday will likely strengthen with a positive retest of 58.18
- Selling pressure intraday will strengthen with a failed retest of 57.48
- Resistance sits near 57.98 to 58.18, with 58.36 and 58.74 above that.
- Support holds near 57.26 to 56.83, with 56.48 and 56.07 below that.
Twitter: @AnneMarieTrades
The author trades stock market futures every day and may have a position in mentioned securities at the time of publication. Any opinions expressed herein are solely those of the author, and do not in any way represent the views or opinions of any other person or entity.


