Stock Market Considerations For March 21, 2017
Stocks look poised to rise today but traders will need to keep an eye on overhead resistance. Key technical support levels continue to find buyers… bulls want this to hold through the week and see follow through higher. Check out today’s economic calendar with a full rundown of releases.
Note that the charts below are from our premium service at The Trading Book and shared exclusively with See It Market readers.
S&P 500 Futures (ES)
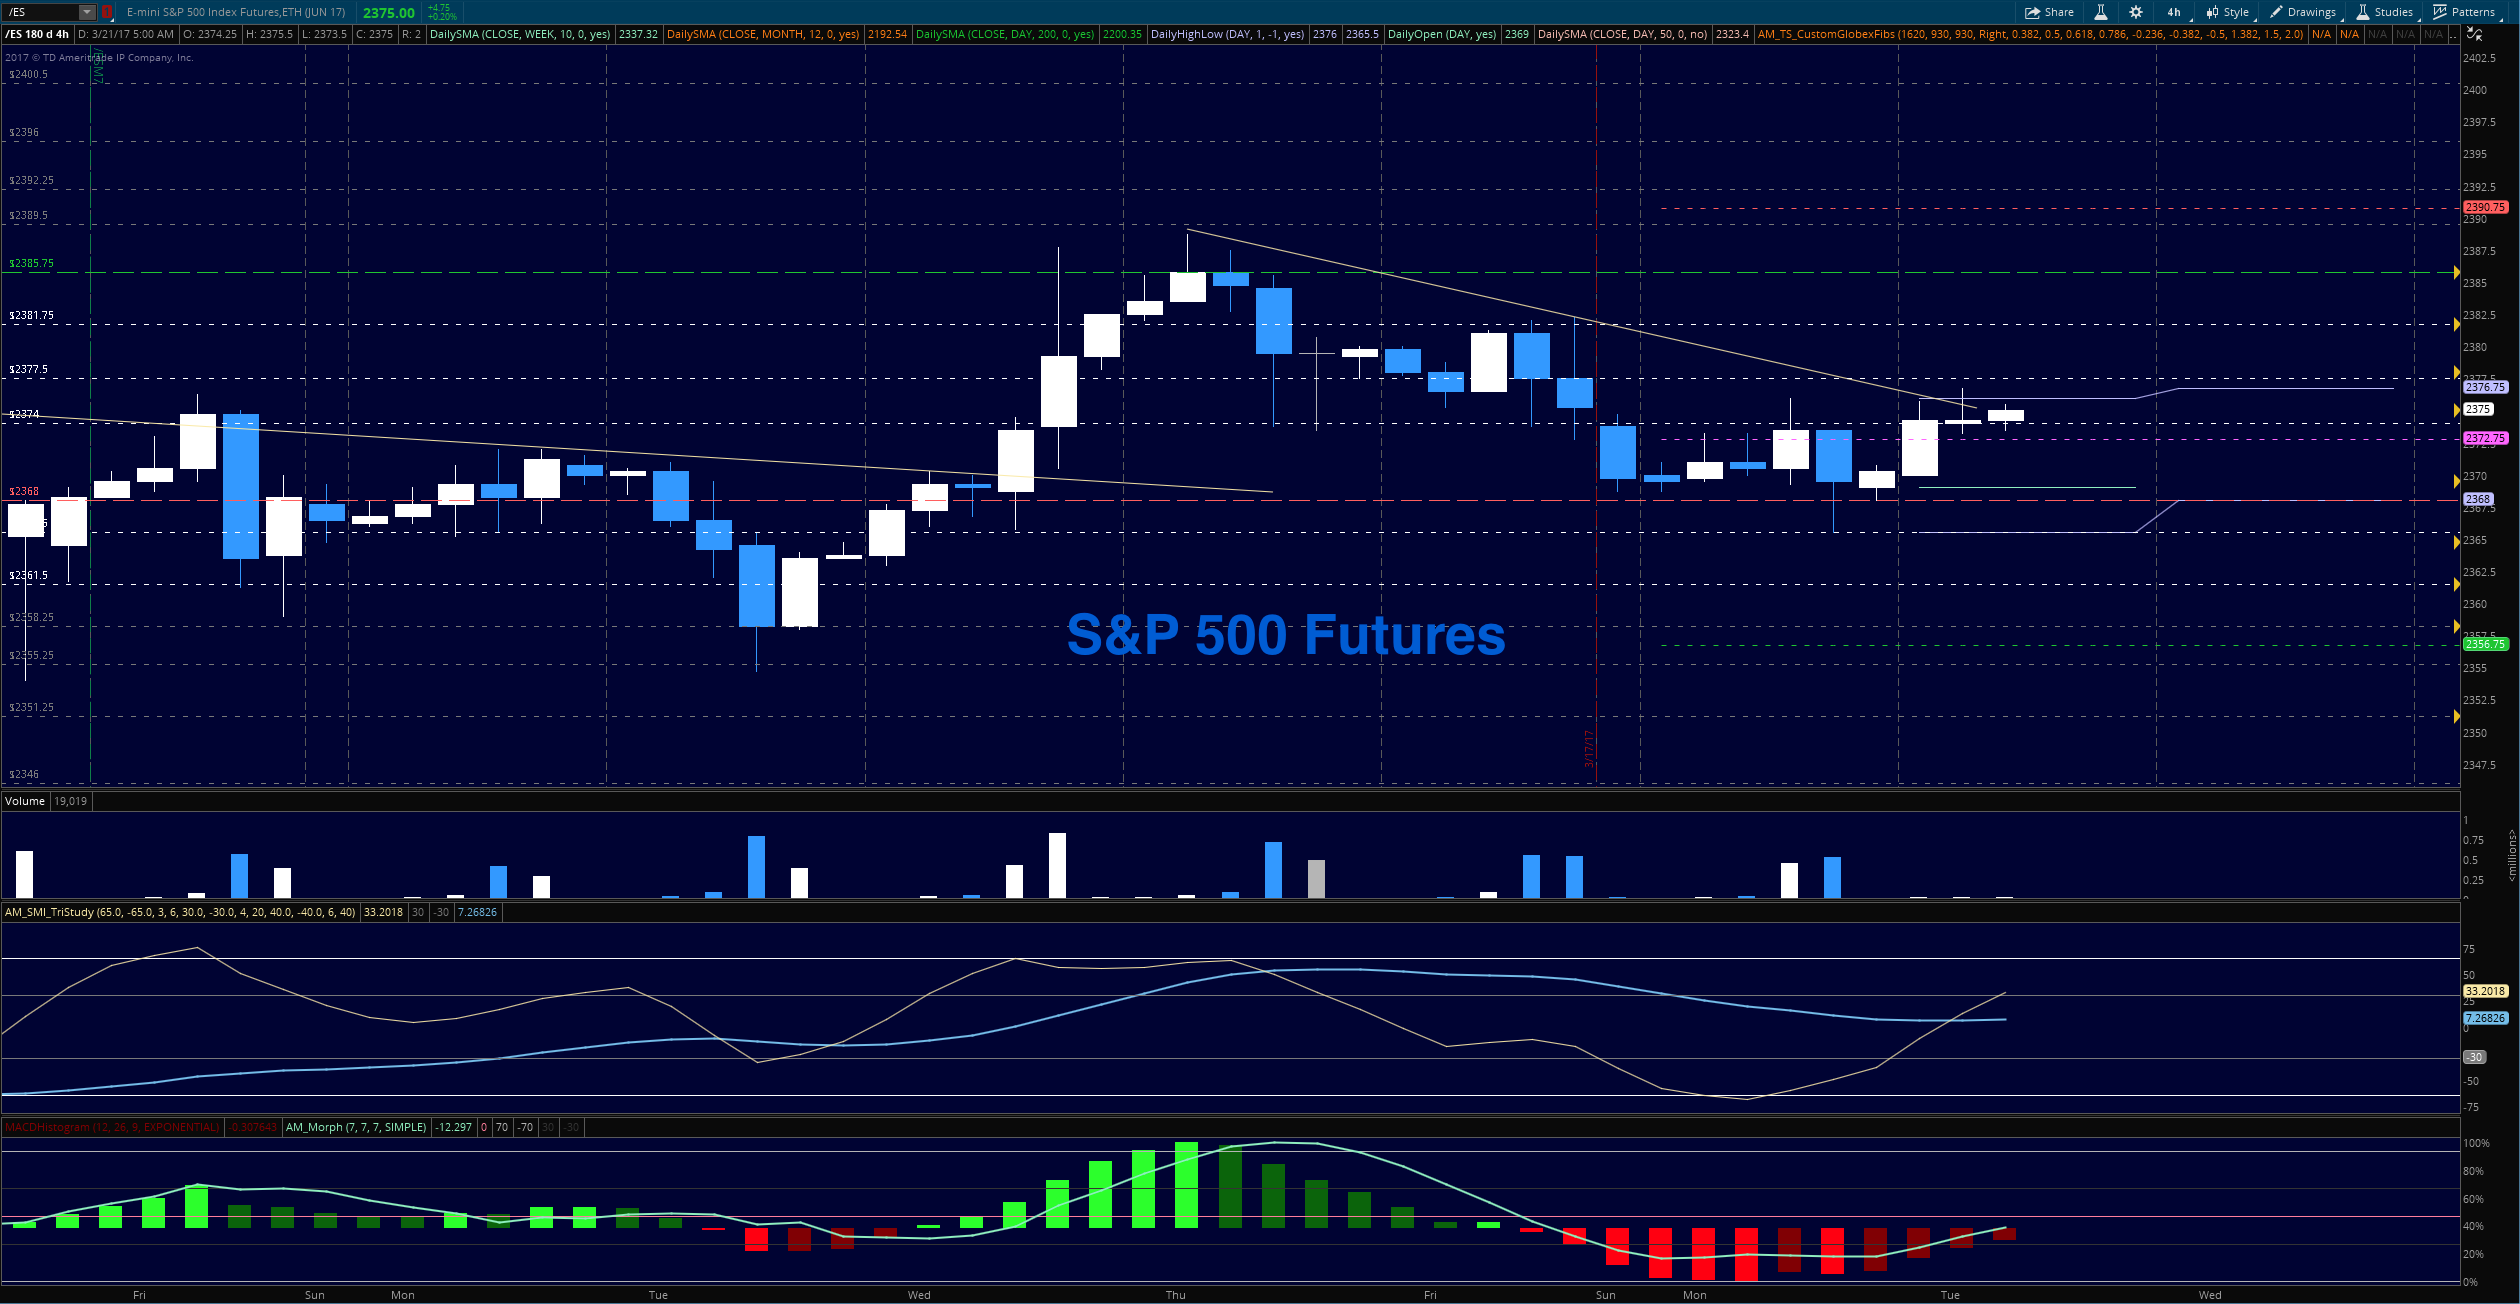
A potential bull flag is forming in the S&P 500 futures with a key level to hold above being 2377. We are in the middle of sideways consolidation within the range between 2259 and 2292. Today, a hold of 2276.50 opens the upside tests into resistance of 2381 and possibly higher if momentum can get some traction. The weekly level of 2368 continues to hold as a buy zone after being tested. A weekly fail of this level could spell trouble but until then, buyers are firmly entrenched and holding upside opportunities. The levels today are quite similar to those of yesterday.
- Buying pressure will likely strengthen above a positive retest of 2377.5 (use caution here as 2381.5 looms just above)
- Selling pressure will likely strengthen with a failed retest of 2368
- Resistance sits near 2381.75 to 2388.5, with 2392.25 and 2397.75 above that
- Support holds between 2368 and 2365.5, with 2361.5 and 2358.5 below that
NASDAQ Futures
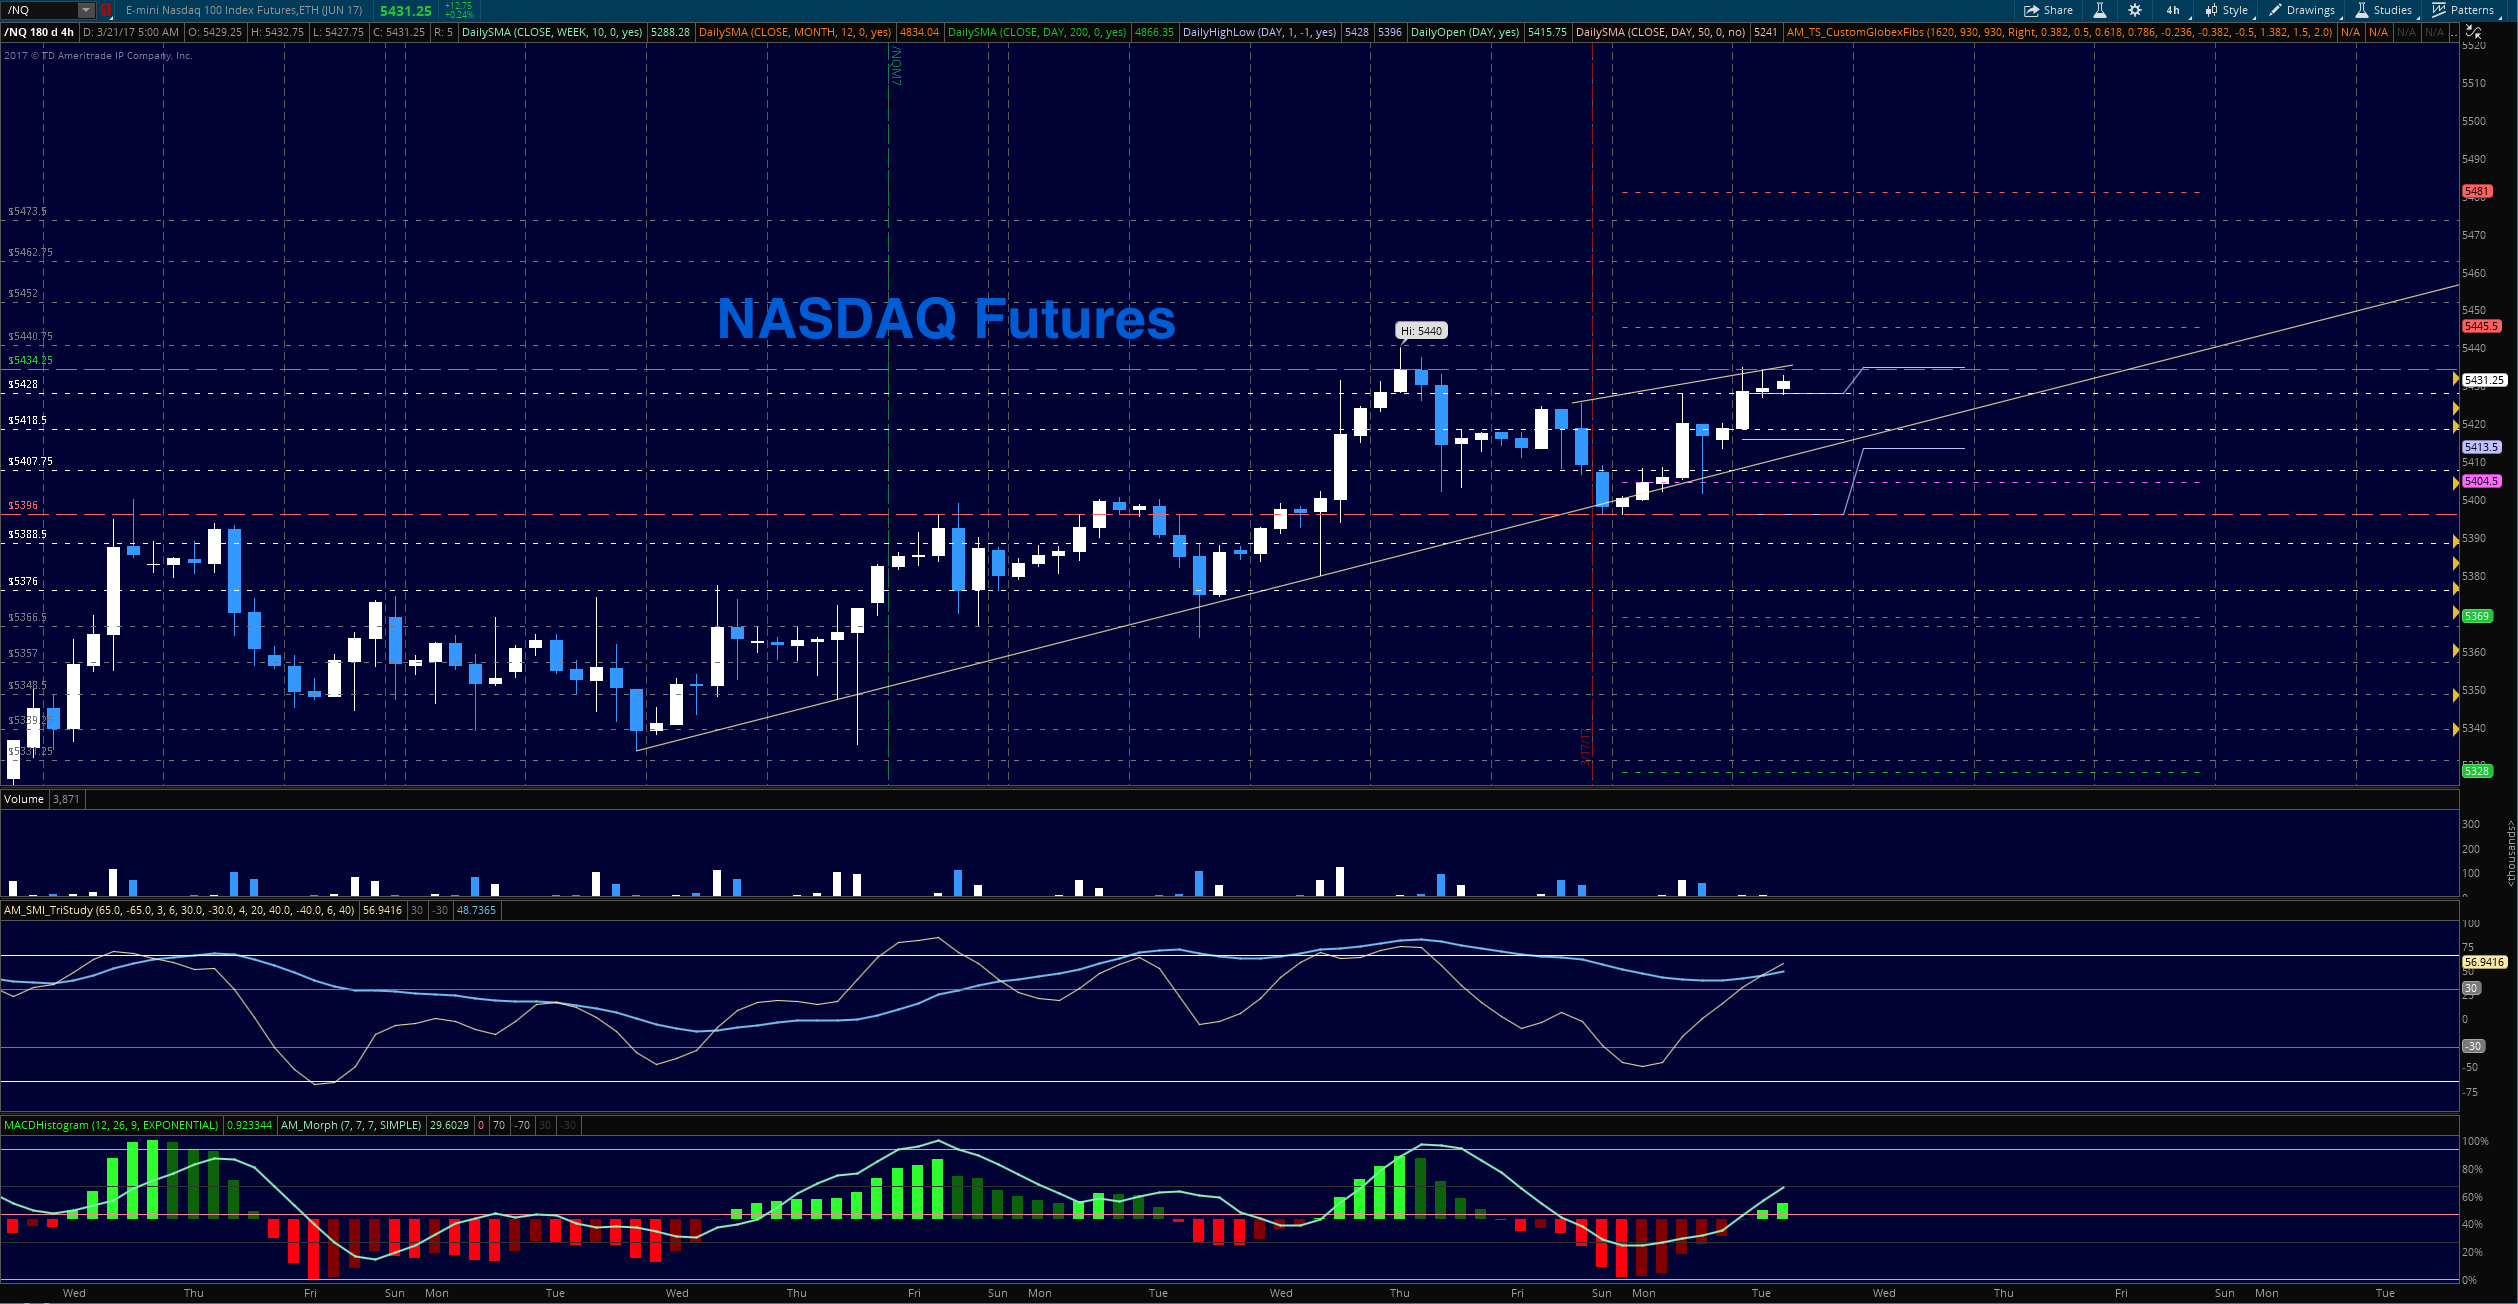
The NQ_F is testing resistance near 5434 this morning but having trouble with the breach and currently shows minimal divergence, so there are no strong ‘tells’ here about continuation other than higher lows in the short term. The breach will likely reject its high and fade back into congestion. As I mentioned yesterday, buyers did become more aggressive over the breach above 5416 but volume here was also less than normal.
- Buying pressure will likely strengthen with a positive retest of 5434.5 (use caution-wait for a retest)
- Selling pressure will likely strengthen with a failed retest of 5396
- Resistance sits near 5434.5 to 5440.5, with 5446.75 and 5452.5 above that
- Support holds between 5405.75 and 5396.5, with 5388.75 and 5376.75 below that
Crude Oil –WTI
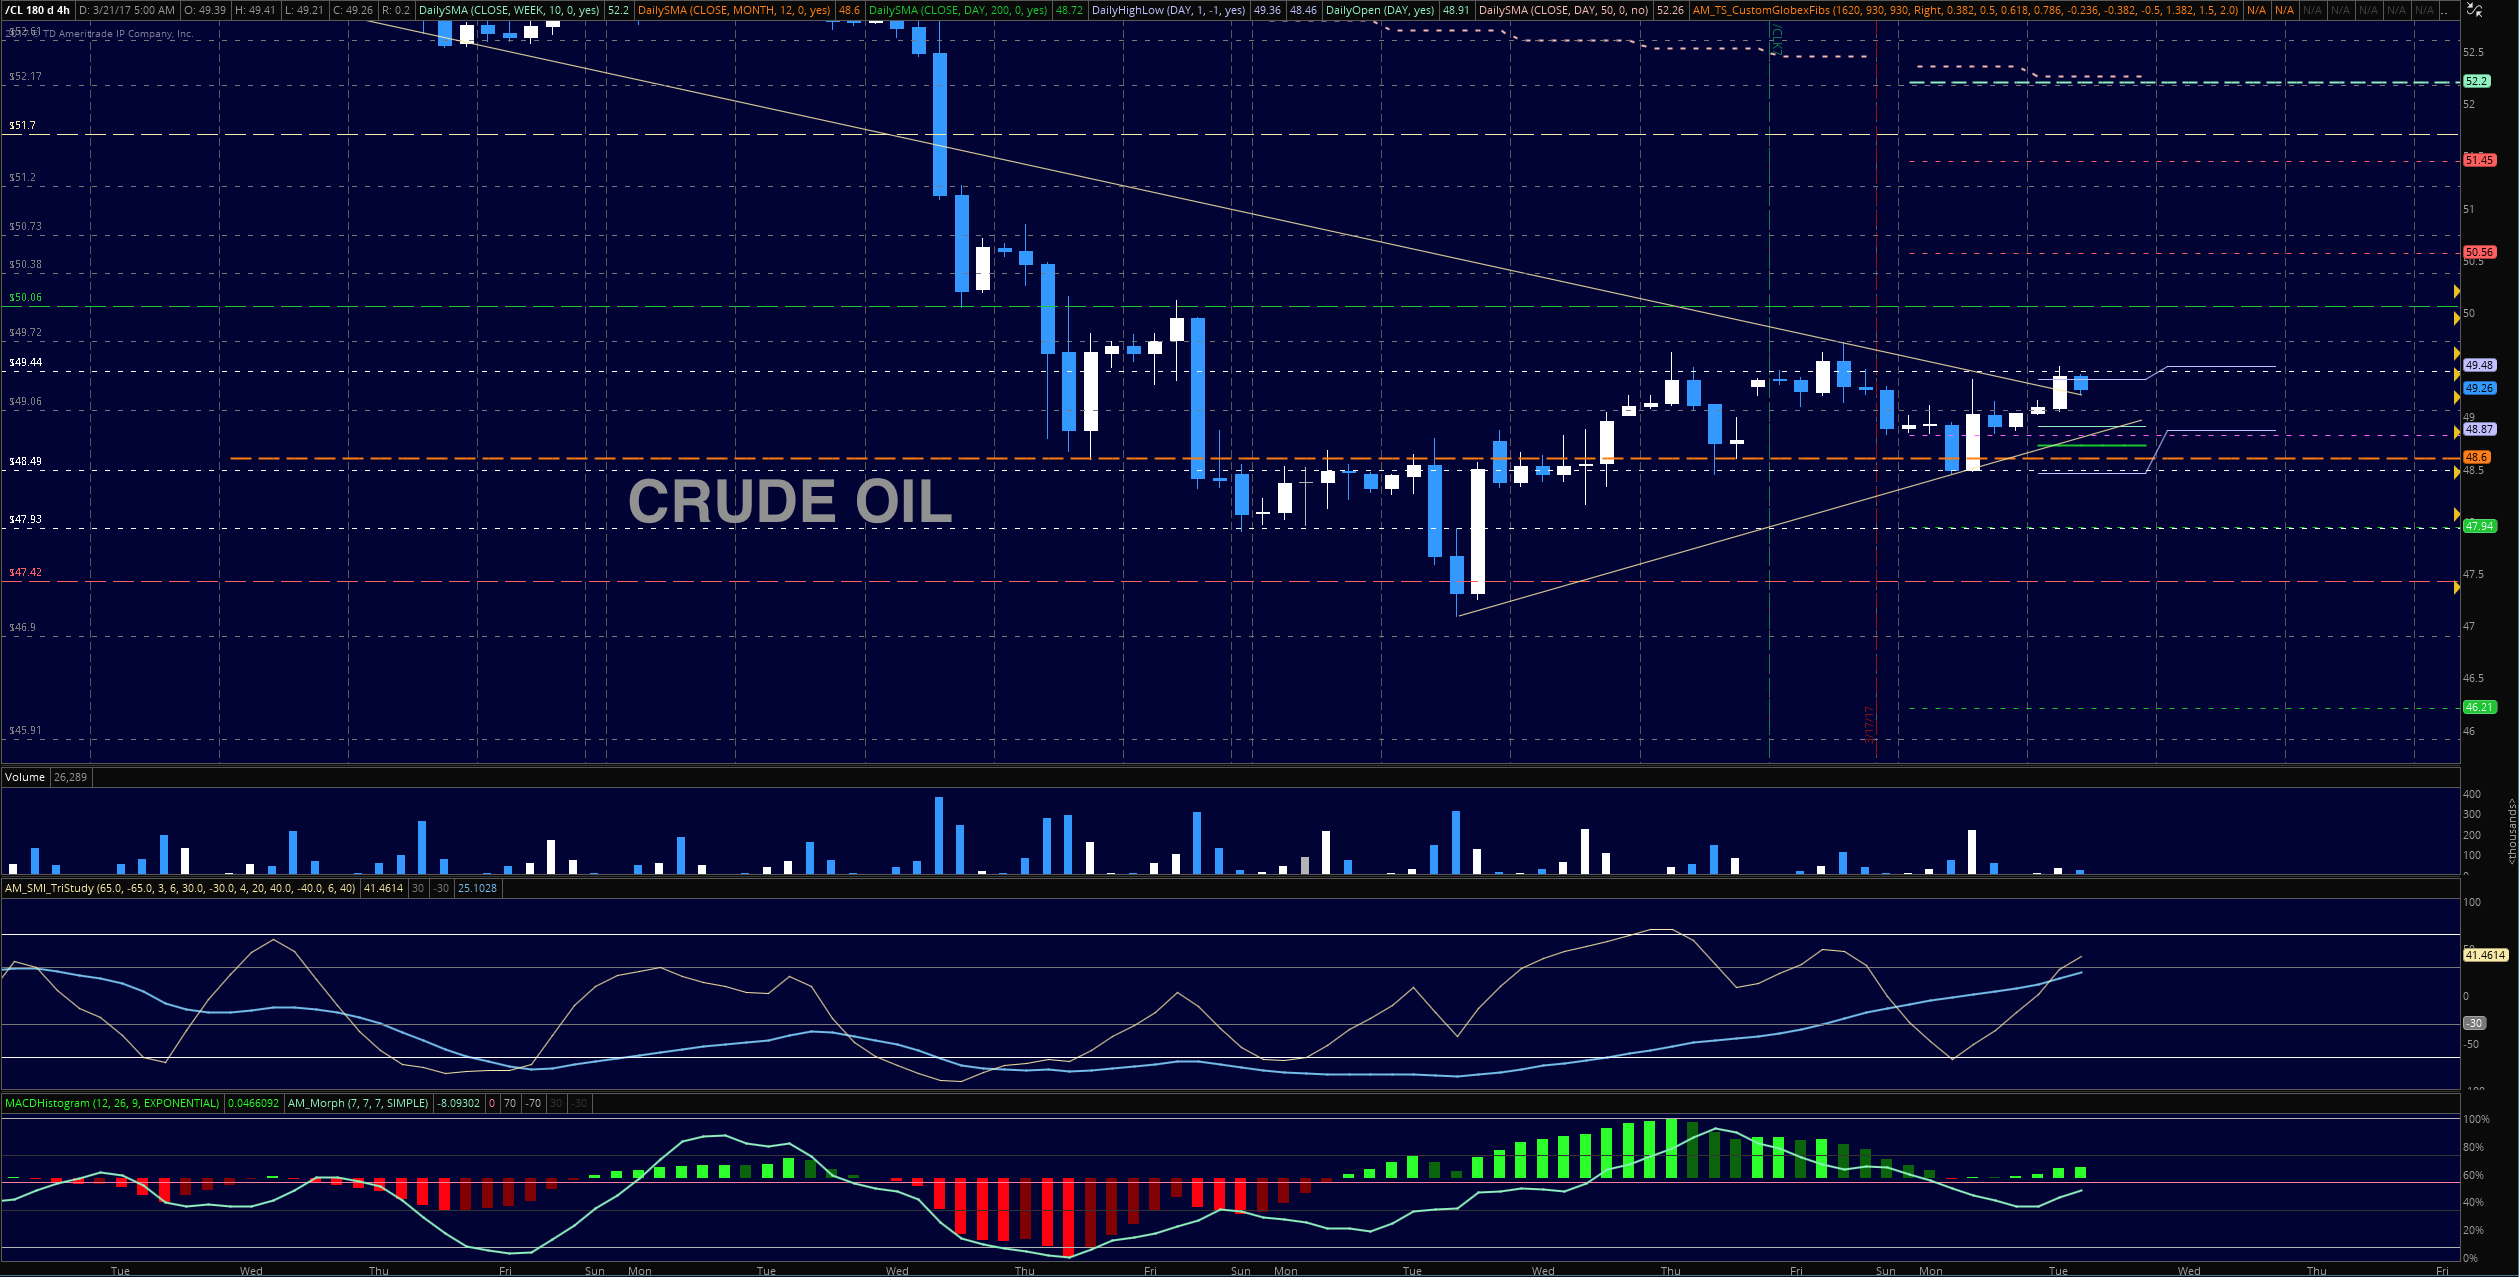
As the API report looms after the close, oil is trying to hold support. With hedge funds holding bigger short positions as the charts rise, it seems that the day might be quite choppy. Tests near 49.68 will present as resistance at first pass, but the chart is currently struggling at 49.35. The bounces off higher support should give us some trading room to go long into the top of the range.
- Buying pressure will likely strengthen with a positive retest of 49.65 (be careful here)
- Selling pressure will strengthen with a failed retest of 48.4
- Resistance sits near 49.48 to 49.74, with 50.06 and 50.74 above that.
- Support holds between 48.55 and 47.94, with 47.62 and 47.42 below that.
If you’re interested in the live trading room, it is now primarily stock market futures content, though we do track heavily traded stocks and their likely daily trajectories as well – we begin at 9am with a morning report and likely chart movements along with trade setups for the day.
As long as the trader keeps himself aware of support and resistance levels, risk can be very adequately managed to play in either direction as bottom picking remains a behavior pattern that is developing with value buyers and speculative traders.
Twitter: @AnneMarieTrades
The author trades stock market futures every day and may have a position in mentioned securities at the time of publication. Any opinions expressed herein are solely those of the author, and do not in any way represent the views or opinions of any other person or entity.


