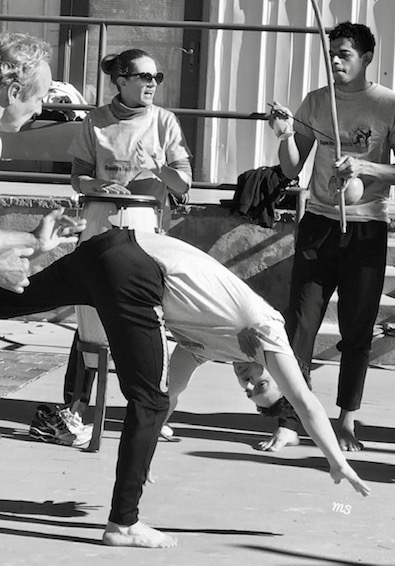
Capoeira is a Brazilian form of martial arts.
The premise is maintaining a dialogue between players using dance, rhythm and movement.
Compare that dialogue to the one we saw today across the stock market indices, a day before the midterm elections, between the bulls and the bears.
Like Capoeira, the stock market hid some potentially violent kicks with musical and rhythmical elements.
For example: The Semiconductors ETF (NYSEARCA: SMH) got some more wind knocked out of it with Google, Amazon and Apple all red.
Yet, Regional and Big Banks (NYSEARCA: KRE) had a good day, a plus after looking like the underdog.
 Since it’s difficult to say what the market might do ahead of the election results, let’s look at some current trends.
The strongest index of the four is Big Blue or the Dow. It is the only one that has returned over the 50-week moving average.
Can the Dow Industrials lead?
It helps, but it is not a leader.
The Russell 2000 (NYSEARCA: IWM), a much better leader and really the market’s choreographer, is still in a caution or warning phase on the weekly charts.
Short-term, it did not have a legitimate reversal bottom. Intermediate term, it’s flashing warning.
Only on the longer-term monthly charts do we see strength. IWM is holding the 23-month moving average at 150.50.
The treasury bonds are in a bearish phase on every timeframe.
Without getting too complicated-you can simply watch the relationship between the Russell’s and the rates.
If IWM cannot hold 150.50, the trend points a lot lower for small caps, which will drag everything down with it.
If the Bonds can stabilize over 112 (TLT), then there is an equally good chance IWM can head back to 160.
Here’s the catch-even with a rally, IWM will still be in a negative phase for both the near and intermediate terms. While TLTs, even if it has a substantial rally, will remain bearish.
Therefore, like two skilled capoeristas, the dialogue between the bulls and bears is one that dodges and counter attacks each other.
Very soon, one will take the other one down.
Key trading levels across stock market ETFs:
S&P 500 (SPY) – 270 support and 275.00 area resistance.
Russell 2000 (IWM) – 150.50 major support with 156.35 the closest resistance point.
Dow Industrials (DIA) – 255 resistance-will be impressive if can clear. 251-250 major support.
Nasdaq (QQQ) – 172.25 the 200 DMA resistance. 169 pivotal number and support based on closing levels.
KRE (Regional Banks) – Really needs to close over 55.
SMH (Semiconductors) – 93.00 support on daily chart with 103.50 overhead resistance.
IYT (Transportation) – 182 the 23-monthly support with 194 big resistance.
IBB (Biotechnology) – 105.40 support on the daily chart with 112 big resistance.
XRT (Retail) – 47.80 the 200 DMA to hold now. 49 closest resistance.
Twitter: @marketminute
The authors may have a position in the mentioned securities at the time of publication. Any opinions expressed herein are solely those of the author, and do not in any way represent the views or opinions of any other person or entity.


