While the stock market has enjoyed a nice bounce, my viewpoint for most equities remains cautious to neutral. This has my focus on commodities.
That said, what might turn us to be more bullish on the stock market?
I love weekly charts. Let’s analyze.
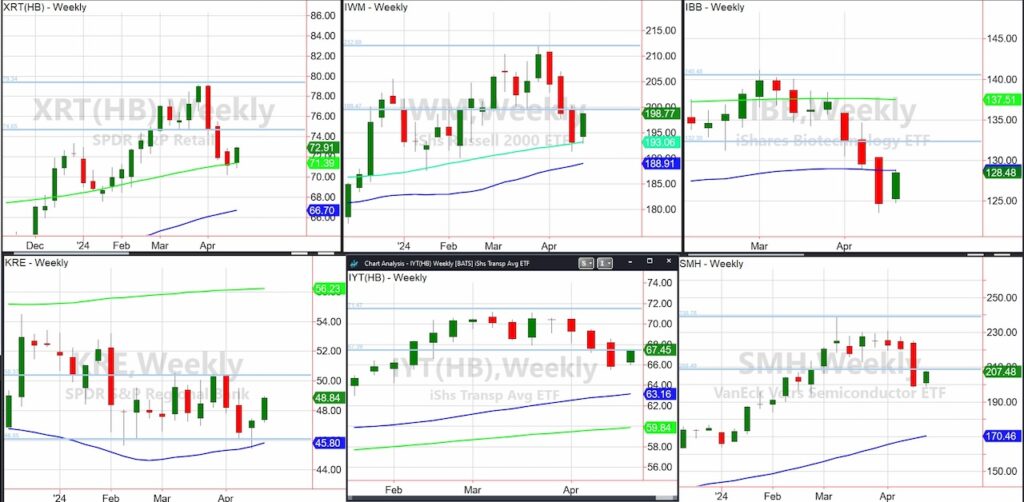
Going from the top row left to right we start with the Retail Sector ETF (XRT).
3 weeks ago, XRT failed the weekly channel giving us fair warning.
Then last week, XRT closed right on the 200-week moving average.
This week, XRT has popped off that support. Bulls want to see a weekly close above 72.87, last week’s high.
Then we will be back to watching the 75 area or where it originally broke down from.
A weekly close under 71.40 would be reason to exercise more caution.
A very similar story with the Russell 2000 ETF (IWM).
IWM, after breaking under the channel, held the 200-WMA and now is testing the bottom of that channel.
Biotechnology (IBB), failed its channel 3 weeks ago and also failed the 50-WMA. This week, that 50-WMA becomes key.
I focused on the Regional Banks ETF (KRE) in interviews and on X.
As the weakest member, KRE last week held both the weekly channel low and the 50-WMA to become a relative outperformer.
This week, KRE trades back to the middle of its recent trading range.
With the top of the channel line the biggest hurdle, that is the most exciting place to watch for KRE to clear or not.
Transportation (IYT) currently tests the bottom of the channel it failed from last week. Worth a watch!
Finally, the Semiconductors Sector ETF (SMH), like IYT, only failed the channel bottom last week, and is also testing that breakdown area this week.
Plus, with lots of earnings on tap, we should know her next direction very soon.
Keep your eyes on the weekly charts and the phases…it will keep you on the right side of the market.
Twitter: @marketminute
The author may have a position in mentioned securities at the time of publication. Any opinions expressed herein are solely those of the author and do not represent the views or opinions of any other person or entity.


