The major U.S. stock market indices have been resilient in the face of negative news.
And this has been a market theme for several weeks.
But considering coronavirus news fears and the pullback in stock market prices, investors need to shift their focus to the price action of market leaders and core indicators for signs of what is next.
One of the leaders that investors should take cues from is large cap technology stocks (and the Nasdaq 100 Index). Tech has been a leader for this bull market and any signs of weakness should be respected.
Note that the following MarketSmith charts are built with Investors Business Daily’s product suite.
I am an Investors Business Daily (IBD) partner and promote the use of their products. The entire platform offers a good mix of technical and fundamental data and education.
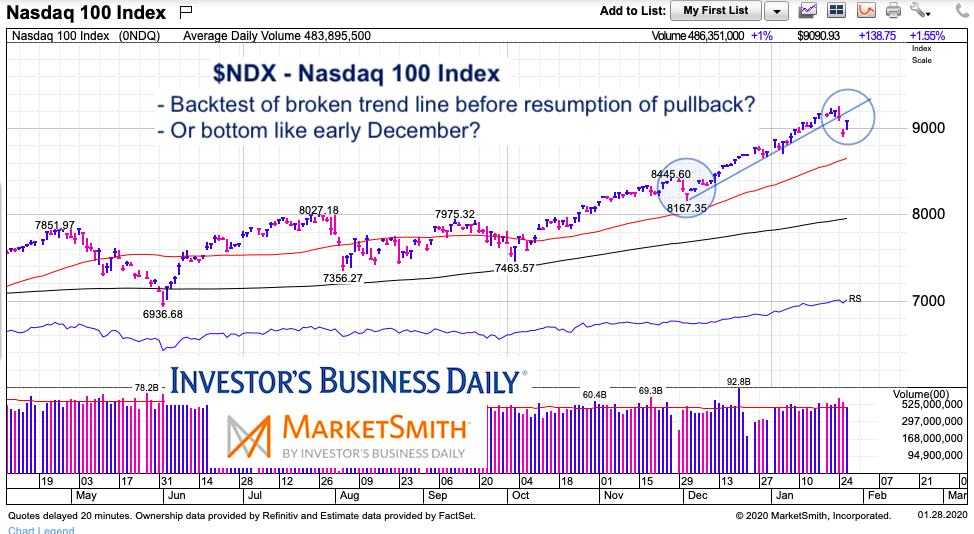
$NDX Nasdaq 100 Chart
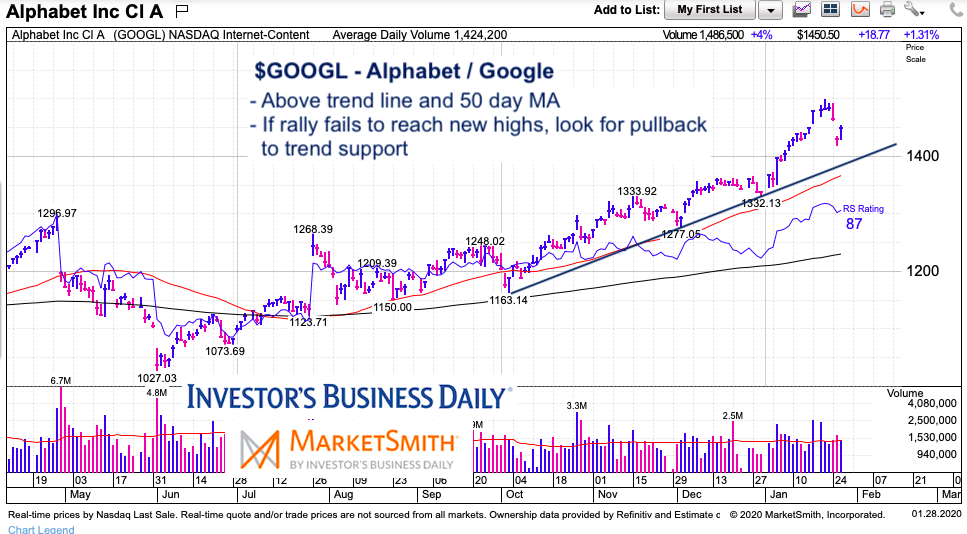
Below are charts of the Nasdaq 100 Index and Alphabet (GOOGL). Alphabet has been one (of many) tech leaders and it’s chart pattern is similar to several other large cap tech stocks (AAPL, FB, etc). How the index and underlying large cap leaders perform in the days ahead will provide clues as to what’s next (higher highs or the beginning of a pullback).

$GOOGL Google Chart

Twitter: @andrewnyquist
The author may have a position in mentioned securities at the time of publication. Any opinions expressed herein are solely those of the author, and do not in any way represent the views or opinions of any other person or entity.


