Monday’s move higher for the S&P 500 Index (INDEXSP: .INX) was impressive. The move was lead by tech, following speculation around Apple’s upcoming event in March.
The rally marks a strong Friday-Monday reversal that caught bears flat-footed, just as they thought bad news (Jobs data and Boeing) would bring more downside.
As I mentioned in my February 28 article, trading timeframes were still favorable for bulls:
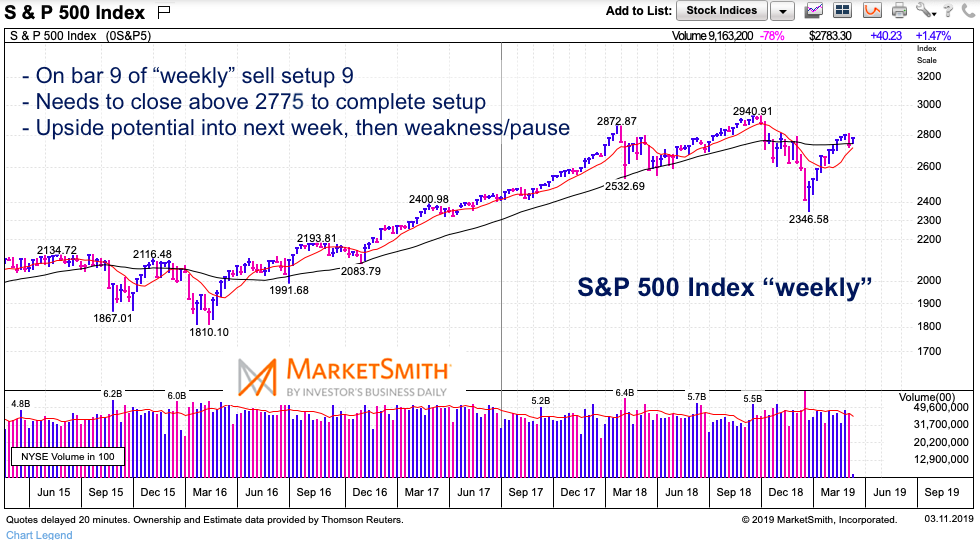
“The S&P 500 index will complete bar 7 of a 9 Demark sell setup this week. A new high next week (or the week after) is necessary for this setup to complete. This could imply the beginning of a pullback and an uptick in volatility by the end of March.”
Note that the following MarketSmith charts are built with Investors Business Daily’s product suite.
I am an Investors Business Daily (IBD) partner and promote the use of their products. The entire platform offers a good mix of technical and fundamental data and education.
S&P 500 “Weekly” Chart
When consider risk/reward, we have to understand our personal timeframes, along with the timeframe that we are doing our analysis.
In this case it is a “weekly” chart with an intermediate term timeframe. The S&P 500 is on the final bar of a DeMark sell setup 9 that should produce a reaction before the end of March. That reaction will be a pullback and we’ll need to use shorter-term indicators to gauge how that shakes out (at that time).
The move higher has right-sided the market and has the indicators pointing to a probable “low” in place. When this move higher ends, we should see a 2-3 week period of volatility.

Twitter: @andrewnyquist
The author has a position in mentioned securities at the time of publication. Any opinions expressed herein are solely those of the author, and do not in any way represent the views or opinions of any other person or entity.


