For much of the decade plus bull market, tech stocks lead the way.
And within that arena, the semiconductors were leaders.
And within any market trend (sector, index, broad market), it pays to keep an eye on leadership. Right now, tech stocks are leading the bear market lower. So we are watching that arena for a change in character.
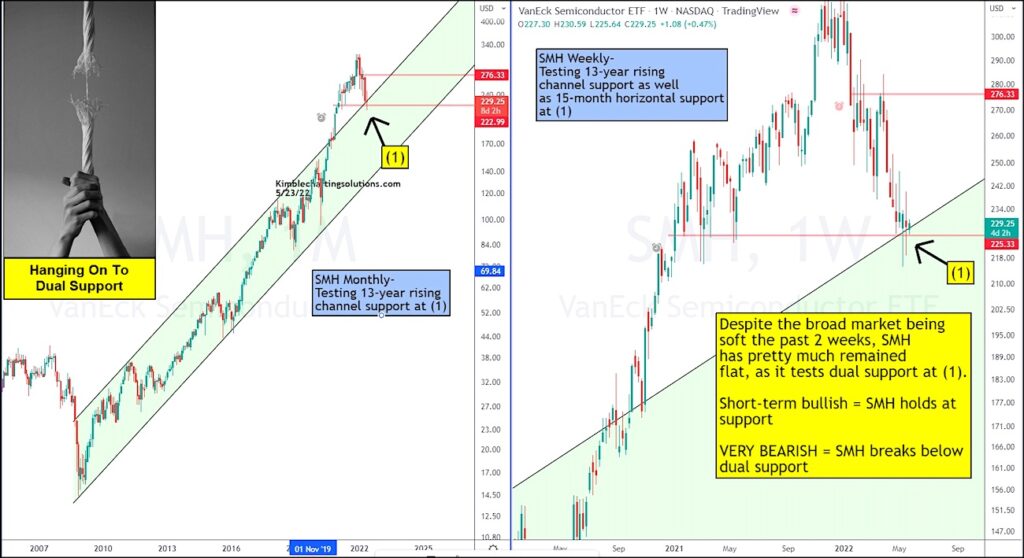
And as today’s chart 2-pack shows, the semiconductors are at a critical juncture… testing support on the monthly and weekly time frames. To put it mildly, bulls need the semiconductors to turn things around.
As we can see, the Semiconductors (SMH) broke out of the top side of its bull market channel and has declined to test the top side (support now) at point (1). This area also marks lateral support.
It is short-term bullish if this tech leader can hold support. BUT it is very bearish if SMH breaks down below support. Stock market bulls are praying this holds! Stay tuned!!
$SMH Semiconductors ETF monthly/weekly Timeframes Chart

Note that KimbleCharting is offering a 2 week Free trial to See It Market readers. Just send me an email to services@kimblechartingsolutions.com for details to get set up.
Twitter: @KimbleCharting
Any opinions expressed herein are solely those of the author, and do not in any way represent the views or opinions of any other person or entity.


