Macro indicators can help investors better understand what’s happening within the broader economy. And this often spills over into the stock market.
The Copper/Gold ratio is one such indicator. And it’s near an important crossroads.
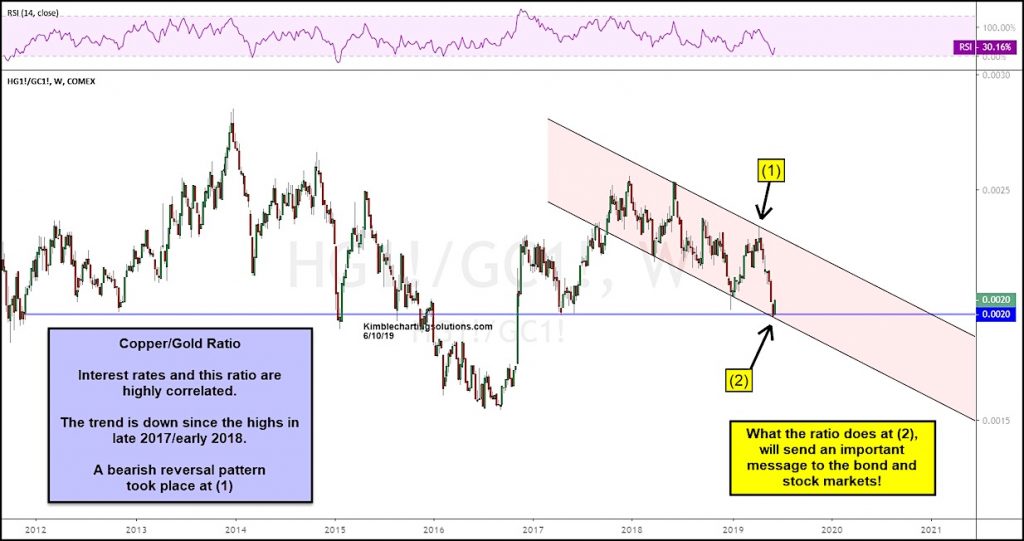
In the chart below, you can see that the Copper/Gold ratio has been in a downtrend since early 2018. And this ratio and interest rates are also correlated – note the big downturn in interest rates over the past year.
When this ratio (and interest rates) are falling, that’s typically not a good sign for the economy and stock market. And after the bearish reversal lower at (1) in the chart below, the ratio (and rates) fell sharply.
Bulls clearly would like to see this ratio turn higher (along with interest rates). And they’ll get their chance – the Copper/Gold ratio is currently testing an important dual-support area represented by lateral support and the lower line of its downtrend channel at (2).
I suspect stock bulls would receive a concerning price message if support breaks at (2) and the ratio heads lower. Stay tuned!
Copper / Gold Ratio “weekly” Chart

Note that KimbleCharting is offering a 2 week Free trial to See It Market readers. Just send me an email to services@kimblechartingsolutions.com for details to get set up.
Twitter: @KimbleCharting
Any opinions expressed herein are solely those of the author, and do not in any way represent the views or opinions of any other person or entity.


