The major stock market indices in the U.S. have been flirting (on and off) with all-time highs for much of the past several weeks.
The only exception has been the small cap Russell 2000 Index.
But that’s a big one.
In my world, there’s the Dow Jones Industrial Average (global view), the S&P 500 Index (domestic large cap view), and the Russell 2000 Index (domestic small cap view). But 2 of them are more important than others right now… at least to me. The Dow Jones Industrials is important as it nears all-time highs, as getting fund flows from global investors is great confirmation. And the Russell 2000, a major laggard, represents smaller companies in America which are the life-blood of the economy. Let’s have a look…
Note that the following MarketSmith charts are built with Investors Business Daily’s product suite.
I am an Investors Business Daily (IBD) partner and promote the use of their products. The entire platform offers a good mix of technical and fundamental data and education.
Dow Jones Industrial Average “weekly” Chart
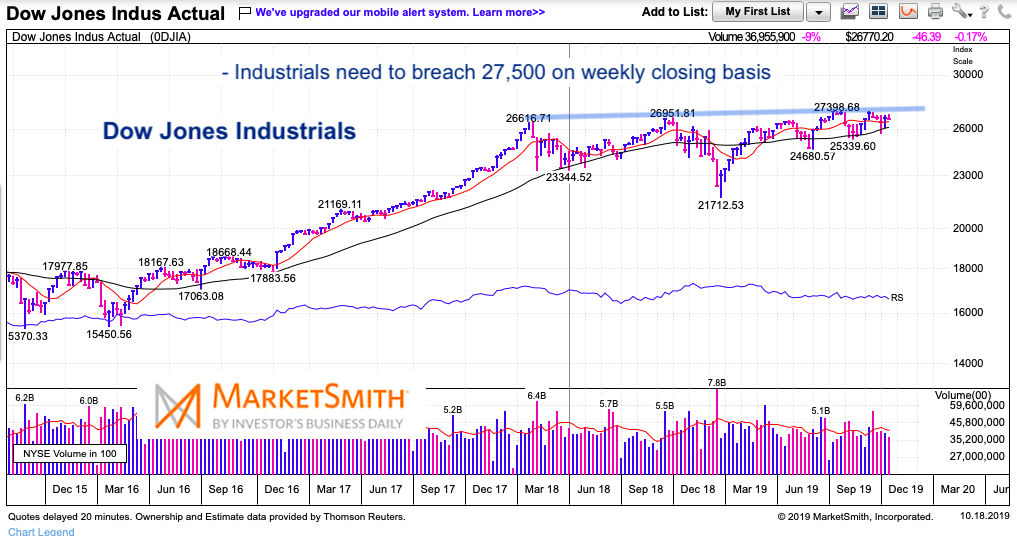
On a weekly basis, investors would love to see the Dow Industrials breakout above 27,500 (the rising trend resistance).
The index is in a narrowing pattern, so it appears that something will give soon. All eyes.

Russell 2000 Index “weekly” Chart
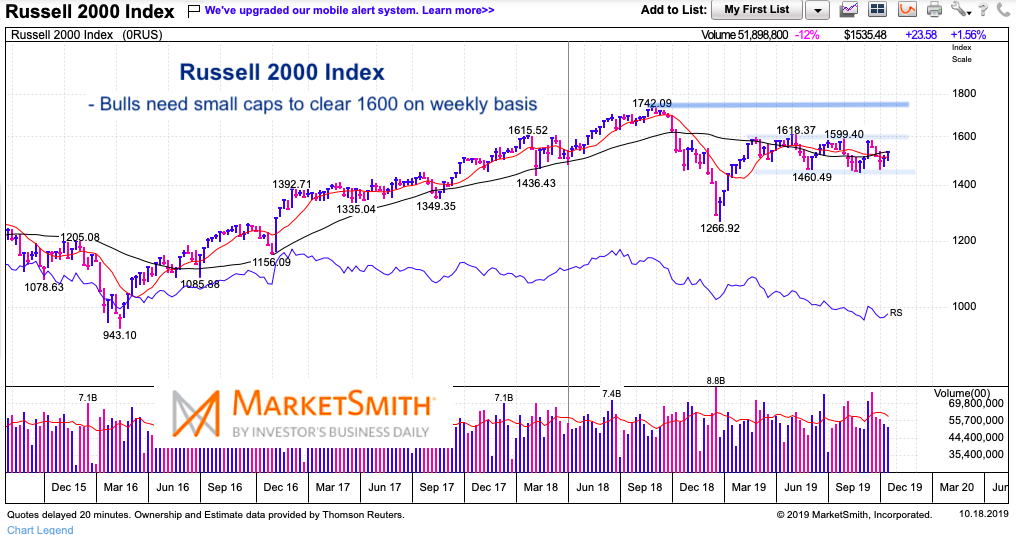
The Russell 2000 is well off its all-time highs (2018) and its 2019 highs. This is problematic… but a breakout over 1600 (and even better 1620) would change the story here. Keep an eye on these levels.
Seeing both the Dow Industrials and Russell 2000 breakout would be very bullish. Wait for it…

Twitter: @andrewnyquist
The author may have a position in mentioned securities at the time of publication. Any opinions expressed herein are solely those of the author, and do not in any way represent the views or opinions of any other person or entity.


