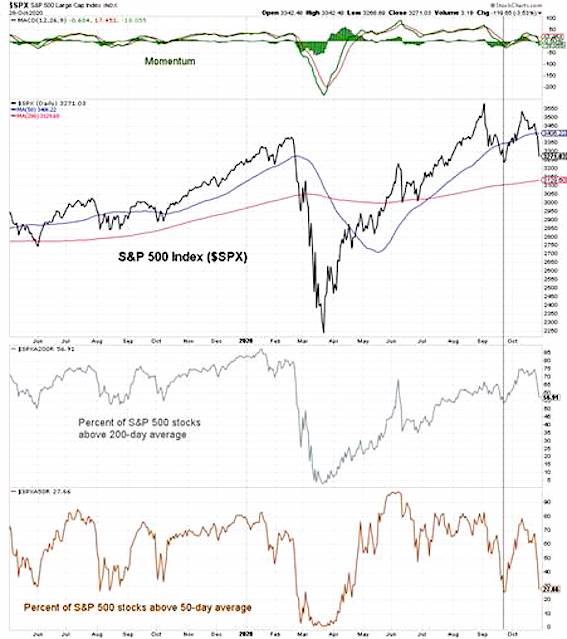
If we are just seeing a re-test of the September lows on the S&P 500 Index INDEXSP: .INX, I would expect stock market breadth and momentum to remain relatively strong while seeing a more complete unwind in optimism than what was experienced last month.
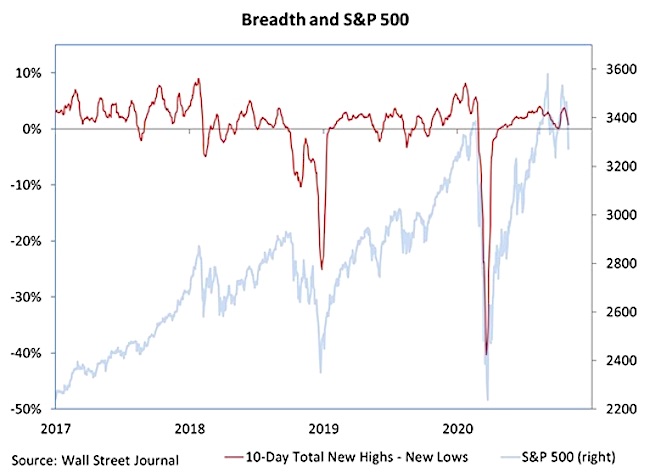
If the weakness of the past two weeks is a warning shot across the bow and in advance of a more protracted period of selling, we are likely to see the opposite – optimism remaining resilient with market breadth & momentum experiencing significant deterioration.
The intensity of this week’s stock market selloff (two days of downside volume out pacing upside volume by 10:1 on the NYSE) is more consistent with the deterioration than re-test scenario. Sector-level trends have also been less-than-resilient.
As the S&P 500 has moved into the vicinity of its September low, the re-test scenario would gain credence if momentum and the percentage of stocks above their 50-day and 200-day averages can hold above their respective September lows. Not seeing a further expansion in the new low list would also be important. At the index-level, recent relative strength from the S&P 500 Equal-Weight index and the Broker/Dealer index is encouraging. The breakdown in the German DAX, which is at its lowest level since May, is not.
The Bottom Line: The September low for the S&P 500 Index near 3225 appears to be important. If optimism unwinds and the market holds that level, prospects for a year-end rally remain good. Breaking that level would introduce a lower low after a lower high and (especially of breadth continues to deteriorate) would make the prospects for a strong year-end rally a bit more challenging.


Twitter: @WillieDelwiche
Any opinions expressed herein are solely those of the author, and do not in any way represent the views or opinions of any other person or entity.


