3. Emerging Market Equities – Vulnerable
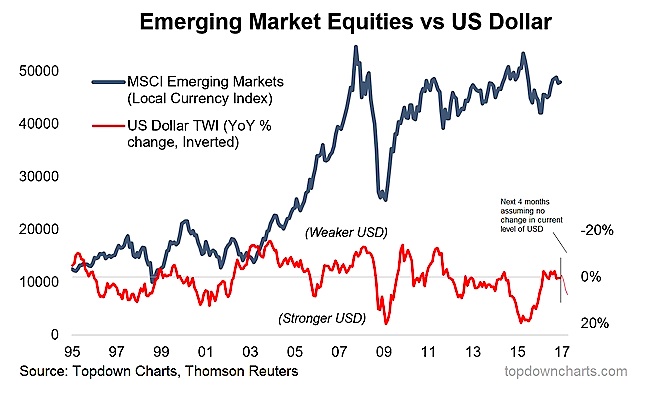
The chart below shows emerging market equities’ vulnerability to the swings in the US dollar (the indicator is the US dollar trade weighted index, year over year change, inverted). This cart is from the latest Weekly Macro Themes report. Typically emerging market equities will face headwinds when the indicator turns down (US dollar strengthens), so it’s worth noting that even if the US dollar index holds steady at the same level for the next 4 months, the indicator will make a notable turn down (to as much as a YoY gain of 8% in April). At the same time emerging market equity ETFs are currently trading right around their 200 day moving average and are thus vulnerable to a breakdown on further US dollar strength.
Overall technical view: Bearish bias, on watch for possible breakdown
Next chart (Treasury Bonds)…


