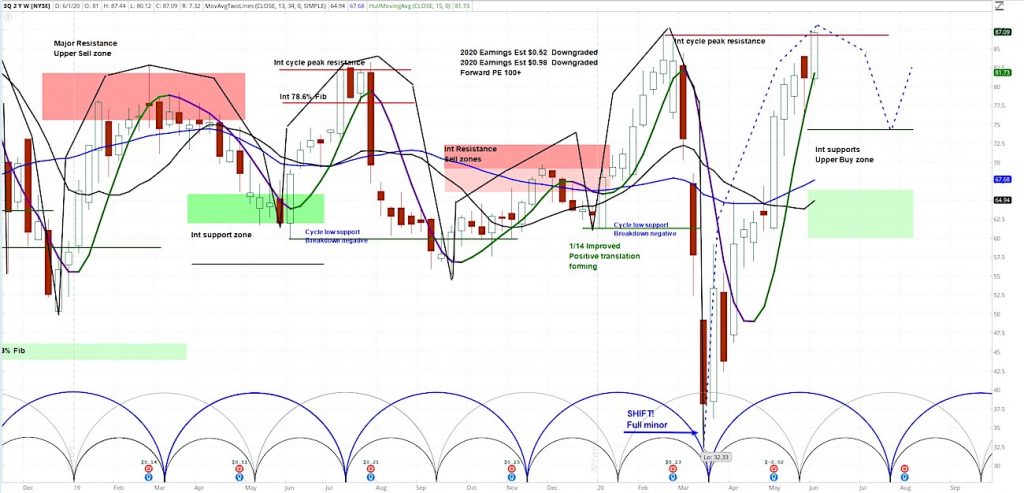
Square (SQ) Weekly Chart
On Tuesday, Bloomberg reported that Western Union (WU) is looking to acquire MoneyGram International (MGI).
MGI rallied 30% on the day.
This news lifted other payment stocks including Square (SQ). SQ is up around 4% on the day.
Let’s review the weekly cycle chart (see chart).
At askSlim we use technical analysis to evaluate price charts of stocks, futures, and ETF’s. We use a combination of cycle, trend and momentum chart studies, on multiple timeframes, to present a “sum of the evidence” directional outlook in time and price.
askSlim Technical Briefing:
The weekly cycle analysis suggests that SQ is likely nearing the end of a rising phase. The next projected intermediate-term low is due in the end of July. Weekly momentum remains positive.
On the upside, the only visible resistance was the prior cycle peak resistance at 87.25.
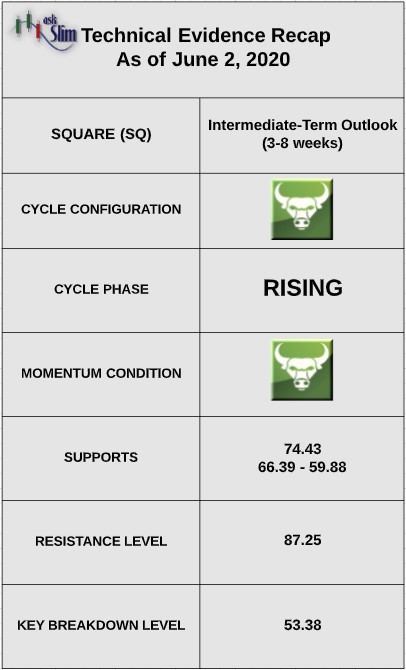
On the downside, there is a rising intermediate-term support at 74.43 followed by another zone of support from 66.39 – 59.88.
askSlim Sum of the Evidence:
SQ is in a rising phase in an overall very extended condition. There is a likelihood that the stock trades back down to the rising intermediate-term supports beginning at 74 by the end of July.
Interested in askSlim?
Get professional grade technical analysis, trader education and trade planning tools at askSlim.com. Write to matt@askslim.com and mention See It Market in your email for special askSlim membership trial offers!
Twitter: @askslim
Any opinions expressed herein are solely those of the author, and do not in any way represent the views or opinions of any other person or entity.
 and Semiconductors (SMH)")
")
 Make A Higher Low?")


 Make A Higher Low?")