The S&P 500 (NYSEARCA:SPY) moved marginally higher last week, closing up +0.3%.
Do bulls have anything left in the tank? Or will bears push stocks lower yet again?
Stocks chop on wild news, but watch out, risk will catch-up…
The week ahead may provide a final fleeting lift for stocks… before another turn lower. See my forecast below (and in-depth video) for more details.
S&P 500 Cycle Outlook for the Week of May 28:
- The stock market chopped around last week, with the S&P 500 (SPX) ending the week up 7 points at 2721, an increase of 0.3%.
- Trump and trade continued to dominate the news, which produced moves in the market; but on the whole had a modest impact.
- Our projection is for stocks to move a tad bit higher early this week and then face a significant period of downside risk for a couple weeks.
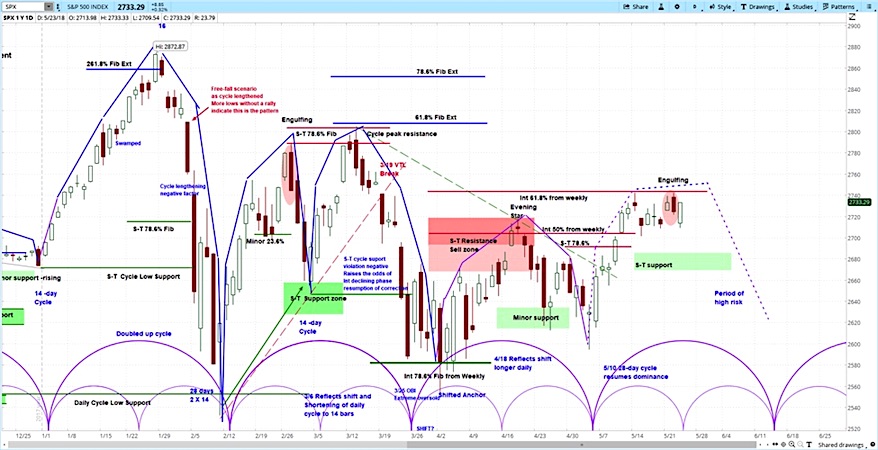
S&P 500 (SPX) Daily Chart from our Stock Index Report
The news cycle last week continued to revolve around the President Donald Trump, with dramatic statements on trade and international relations that were sometimes reversed shortly thereafter. However, the market appears to have adapted to this bluster, simply chopping around in a small range. This begs the question, does the market increasingly perceive this as noise intended to divert attention from other issues – or is this just “Trump tactics”?
The week began on Sunday with Treasury Secretary Steven Mnuchin announcing on Fox News that the US and China had agreed to suspend their proposed tariffs and focus on negotiating a wider trade agreement. On Monday, the S&P 500 opened higher, gaining 20 points or 0.7% by the close. Yet tariff beneficiaries such as US Steel (X) fell nearly 4%.
On Tuesday, the Chinese government announced it would reduce import taxes on automobiles from the current level of 25% to 14% on new cars and from 10% to 6% on components. Ford (F) and General Motors (GM) rallied on the news, as did as European automakers. However, the broader US and Chinese stock markets both declined on the day.
Wednesday began with an early morning tweet from Trump in which he reversed Sunday’s optimism with regard to trade negotiations. “In the end we will probably have to use a different structure,” he explained, “as this will be too hard to get done.” Stocks chopped around, ending 9 points higher by the close. The main driver though may have been Fed minutes that were perceived as dovish, due in part to a willingness to let inflation temporarily move higher.
Later that day, Trump directed the Commerce Department to investigate whether imports represent a threat to US automakers. “There is evidence suggesting that, for decades, imports from abroad have eroded our domestic auto industry,” explained Commerce Secretary Wilbur Ross.
On Thursday, Trump cancelled the meeting that was being planned with North Korean leader Kim Jong-Un in a letter that implied he may have had mixed feelings about the decision. Stocks swung lower. Home sales data then fell to 5.46 million in April from 5.6 million in March, coming in below the average estimate of 5.56 million. Home prices increased 8.7%, the fastest rate in 16 years. By the end of the day, the market fell but only by 5 points.
On Friday, crude oil fell below the $70 level again, which was a 4.5% drop. The move happened after a meeting between Russian and Saudi Energy Ministers Alexander Novak and Khalid Al-Falih. Novak later said that OPEC and its allies could begin raising production targets again, ostensibly in response to declining Venezuelan output and renewed US sanctions on Iran.
To top everything off, Trump revealed in the afternoon that planning with North Korea waa proceeding and the meeting may even take place on the date previously planned.
With equities up last week, gold was up 0.85%, and oil was down 5.33%, the euro was down 1.09%, and 10-year treasuries were up 0.98%.
Our Projection for the S&P 500 This Week
Our analysis of the S&P 500 over the coming two weeks is for the stock market to face a period of risk, as shown on the chart above taken from the askSlim Stock Index Report. The purple cycle brackets on the bottom represent the market cycles. We see a possible move higher early next week, with resistance at 2744. We are then looking for a downside move of 125-150 points over the coming two weeks.
There is further risk in the subsequent market cycle. The reason that we see this period of risk approaching is our projection for the conclusion of a longer-term market cycle. This is explained in our Big Picture Analysis, which looks at the declining phase of the current cycle.
Here’s our latest askSlim Market Week video:
Twitter: @askslim
Any opinions expressed herein are solely those of the author, and do not in any way represent the views or opinions of any other person or entity.


