Value Line Geometric Index
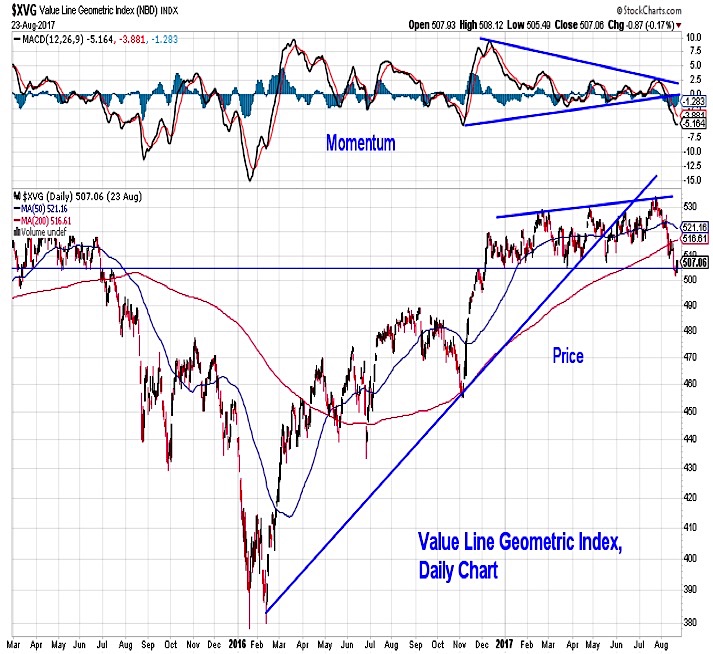
The Value Line Geometric Index is a proxy for the broad market, as it essentially gauges the performance of the median stock in the index. After making a new all-time high in July (and breaking through 20-years’ worth of resistance), the index has faltered in August. Momentum has failed to hold support at the rising trend line and the index itself is back to flat on a year-to-date basis.
Copper Prices
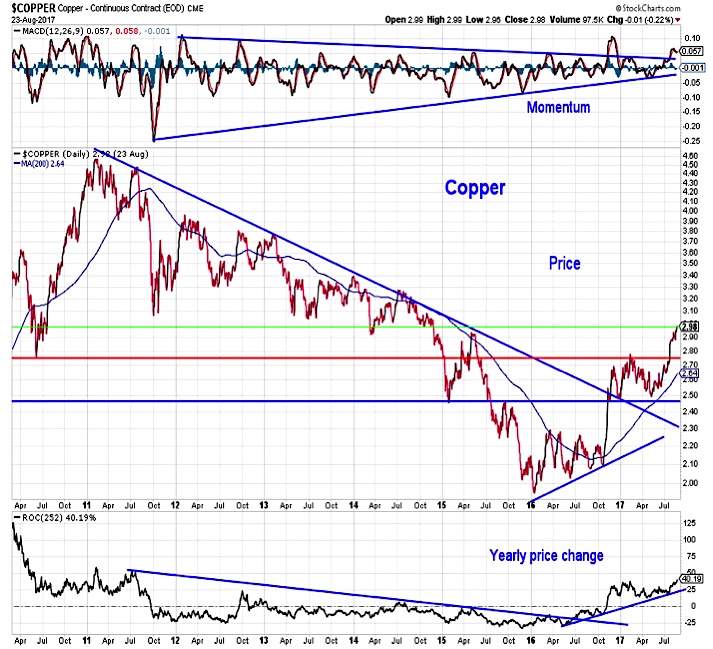
Copper appears to have completed its price consolidation with the momentum up-trend still intact. This is helping support an upside breakout that has pushed copper to its highest level since 2014. Other industrial metals are also making new multi-year highs.
10 Year US Treasury Yields
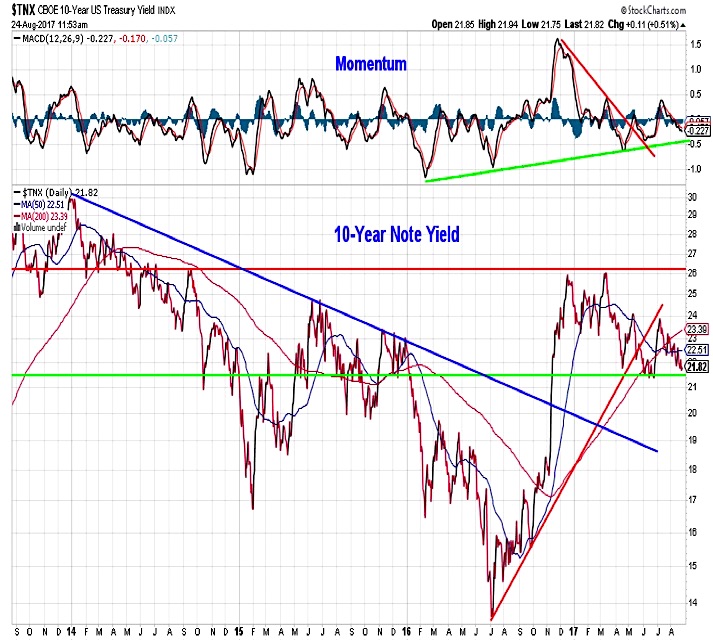
While copper seems to be providing a vote of confidence in the economy, Treasury yields suggest more caution (or perhaps just Fed-related skepticism).The yield on the 10-year T-Note has moved back toward its lows of the year (just above 2.1%). If the Fed continues with its plan to reduce its balance sheet (and sell Treasuries) this could put upward pressure on yields as we move toward year-end.
S&P Financial Sector
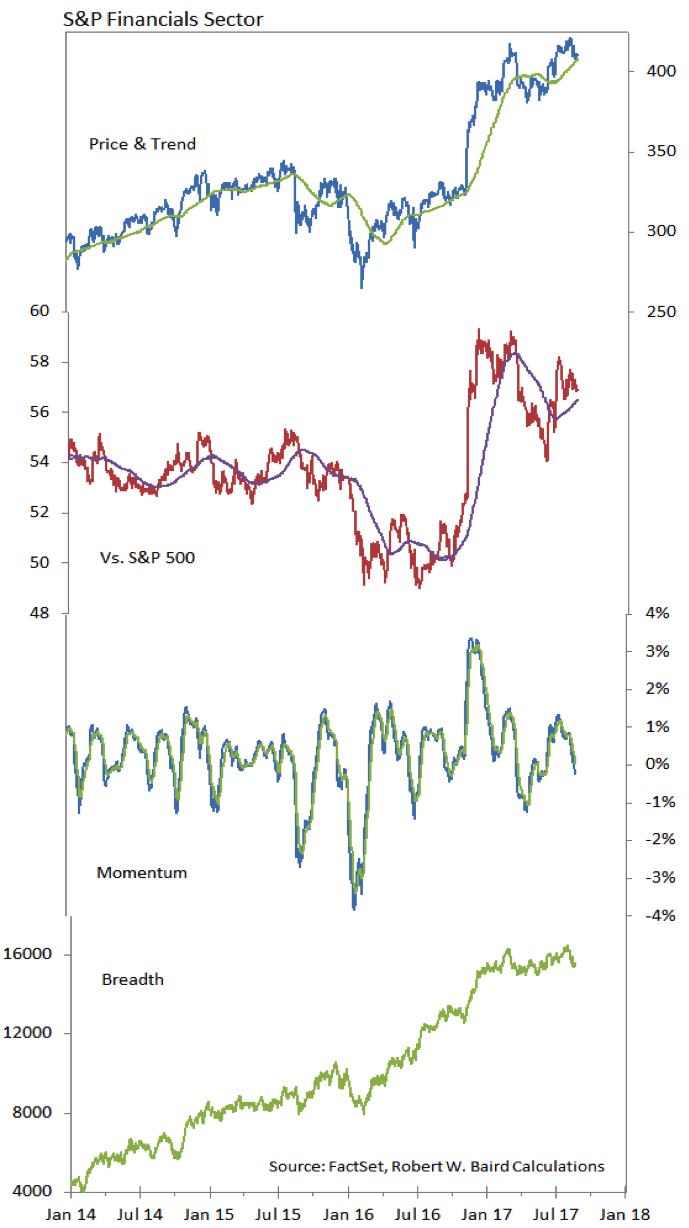
Higher bond yields could help the Financials sector get back in gear. While it has managed to stay in our relative strength rankings leadership group, momentum in the sector has clearly faded and the relative price line has been unable to get back to the early year highs (which came as the 10-year T-Note yield was approaching 2.6%).
Thanks for reading.
Twitter: @WillieDelwiche
Any opinions expressed herein are solely those of the author, and do not in any way represent the views or opinions of any other person or entity.

