Key Takeaways: Indexes bounce but momentum and breadth not providing evidence that risks have receded. Best evidence that a meaningful low has emerged will be apparent only after the fact.
We are still looking for an upside volume thrust. Sentiment and seasonals could soon improve, but are not there yet.
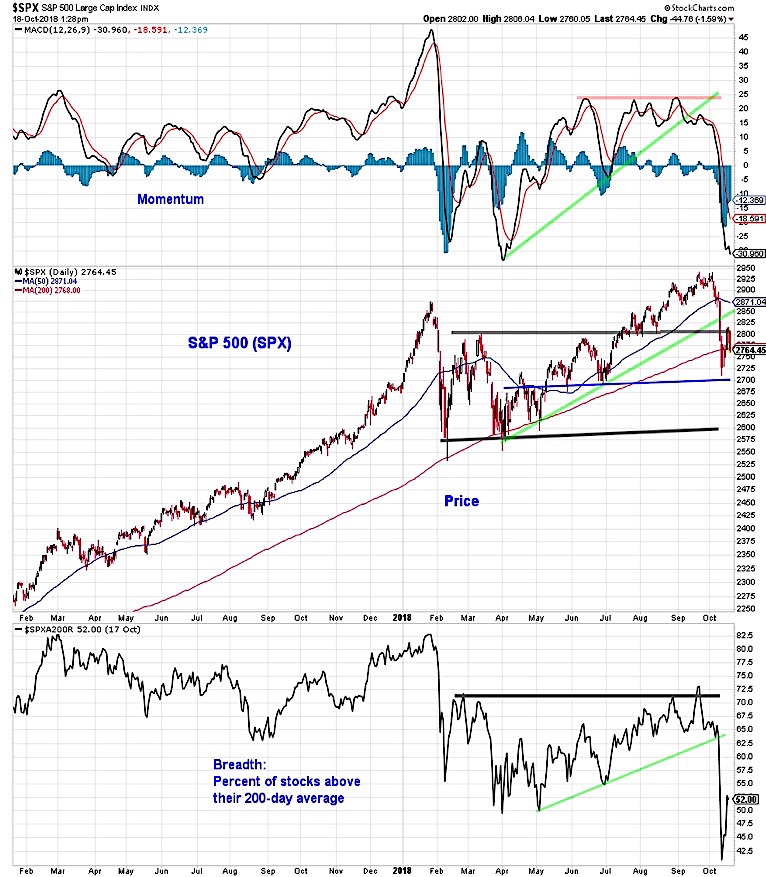
The S&P 500 has bounced off of last week’s lows, finding support near 2700, resistance near 2800, and multiple opportunities to touch the 200-day average near 2775. Momentum and breadth have yet to provide evidence that downside risks are waning. Momentum failed to confirm the new index-level highs this summer and the marked deterioration in momentum that emerged in September anticipated this month’s price weakness. Momentum has yet to turn high even though the S&P 500 is well off of last week’s lows.
From a breadth perspective, the percentage of stocks trading above their 200-day averages has bounced off of last week’s low but we have yet to see evidence that a sustainable, broadly based rally is emerging.
S&P 500 Trading Chart
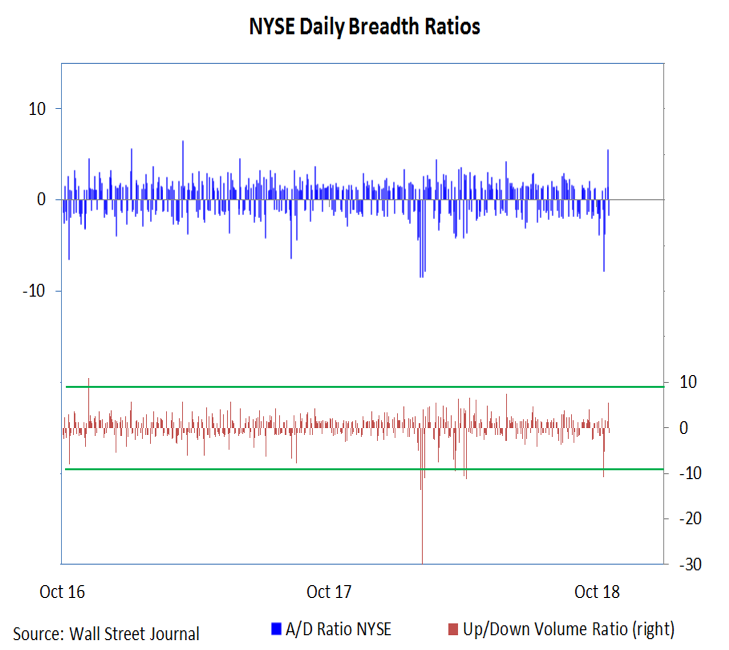
The 10-to-1 down volume day on the NYSE last week (in last week’s Market Commentary, we showed this was 26-to-1 when using only common stock data) was the seventh such day of overwhelming downside volume experienced in 2018. We continue to look for at least one trading day where upside volume outpaces downside volume by better than 10 to 1 as evidence that a sustainable rally is emerging. Upside volume thrusts have been conspicuous by their absence in 2018. The best we have seen this week was less than 6 to 1.
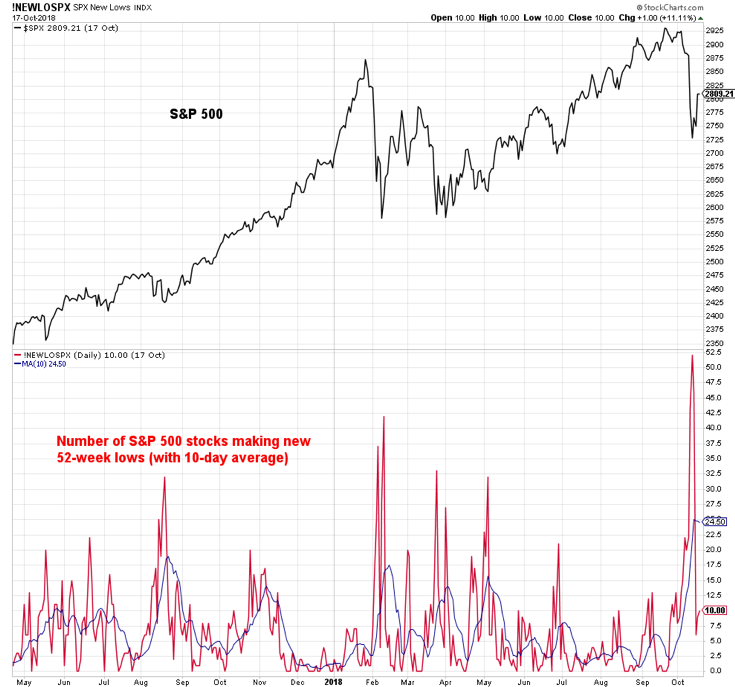
The percentage of stocks above their 200-day averages mentioned on the first page is just one of several breadth indicators that moved to new extremes last week. After seeing the new high list contract even as the S&P 500 moved to a new high in September, last week witnessed a meaningful expansion in the new low list. New lows have contracted as the index has tried to stabilize this week.
A more meaningful test will come if/when the index moves back toward last week’s lows. Fewer stocks making new lows on an index-level re-rest would be a positive development. While there may be a desire to try to call turns in the market as they happen, a better approach to managing risk is to wait for evidence that suggests a turn has taken place. So far, that evidence is lacking.
With various breadth indicators breaking down, it may take a more significant shift from optimism to pessimism than has been seen to date to suggest the sentiment backdrop has meaningfully improved. At a minimum, this may mean seeing the NAAIM Exposure drop below 30% (this week it rose from 53% to 68%), seeing AAII bears move above 43% (currently 35%) and II bears getting above 21% (currently glued to 18%). The NDR Crowd Sentiment Poll (a composite sentiment indicator) shows that sentiment is moving into pessimism zone and is reaching its early year-lows, both of which are encouraging developments.
With election day rapidly approaching (though for some, not getting here nearly soon enough), we are watching for evidence that the typically favorable seasonal patterns are indeed emerging. Anecdotally, seeing headlines questioning whether a Q4 rally will emerge would be a positive development (and evidence that pessimism is becoming more pronounced).
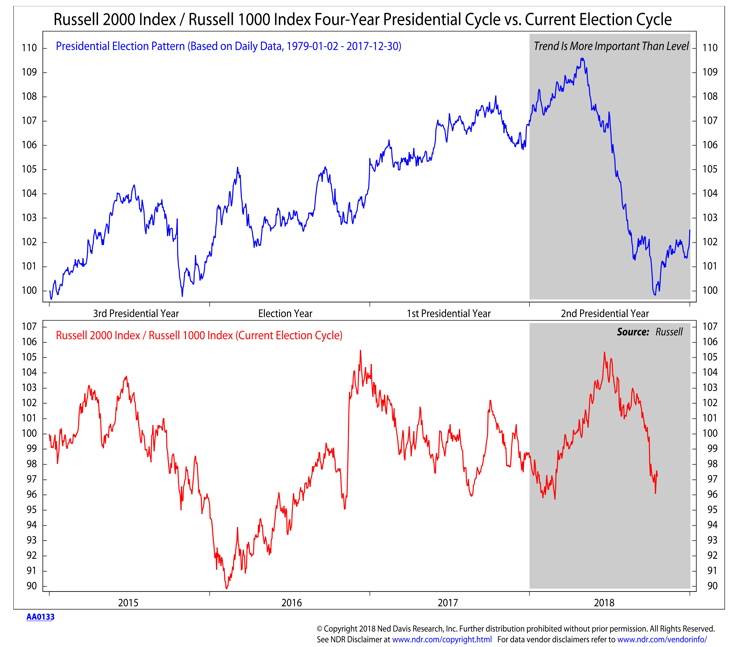
In terms of market action, we are watching both the ratio between small caps and large caps and also sector-level leadership for evidence that seasonal trends have turned more favorable. Small caps typically weaken ahead of mid-term elections and lead the rally in their wake. Likewise, defensive sectors tend to see relative leadership peak just ahead of the election.
Twitter: @WillieDelwiche
Any opinions expressed herein are solely those of the author, and do not in any way represent the views or opinions of any other person or entity.

