 By Andrew Nyquist
After pushing higher for much of the week, the S&P 500 took investors for a ride lower on Friday. Although the move lower wasn’t so much of a surprise in hindsight, it did catch many bulls looking “up.”
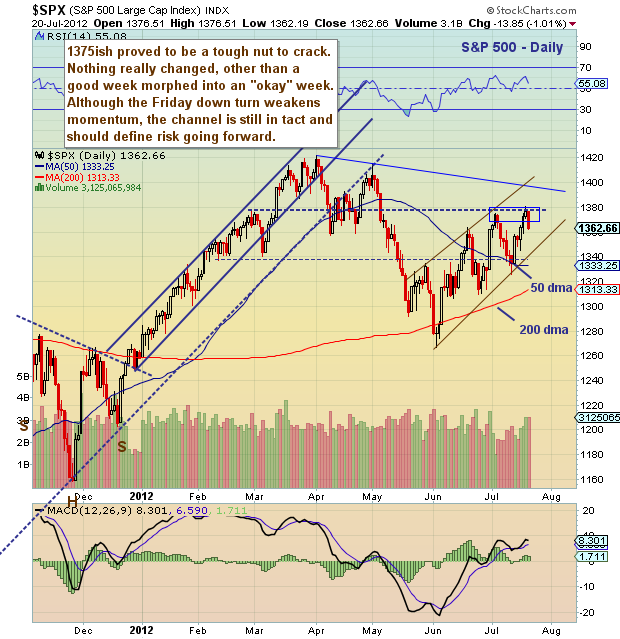
The bull’s excitement was due in part to last week’s shakeout just below the S&P 500 uptrend line and subsequent reversal 50 points higher. As well, the index was running on momentum into a band of resistance at 1375. This momentum caused many bulls to look past the 1375 level and up at the old highs (1400+)… but that’s just the short-term psychological take.
In technical reality, the index is hanging out between support and resistance. Overhead is that pesky 1375 level, while the uptrend line provides support below. A sustained move above or below those levels should guide your short term trend analysis.
That said, the conditions have been brutal. A weather report for the markets would probably read partly sunny with a chance of hail. In short, it has been one choppy ride. And this chop wears on investors. The up and down emotional roller coaster tests the very core of our discipline. This is why I try to tune out the noise, slim down my positions, and focus on technical levels and good trading setups during periods of market uncertainty.
I’ve included a chart of the Volatility Index (VIX) for your viewing pleasure. Please note that although the VIX is caught in a downtrend channel that investors must respect, Monday is bar 7 of a daily DeMark buy setup. If this setup continues and indeed records, then I’d expect more volatility next week.
Trade safe. And remember that investors can further define their market risk by monitoring technical setups and support/resistance levels.
S&P 500 Daily Chart:
Volatility Index Daily Chart:
———————————————————
Twitter: @andrewnyquist and @seeitmarket Facebook: See It Market
No position in any of the securities mentioned at the time of publication.
Any opinions expressed herein are solely those of the author, and do not in any way represent the views or opinions of his employer or any other person or entity.


