 By Andrew Nyquist
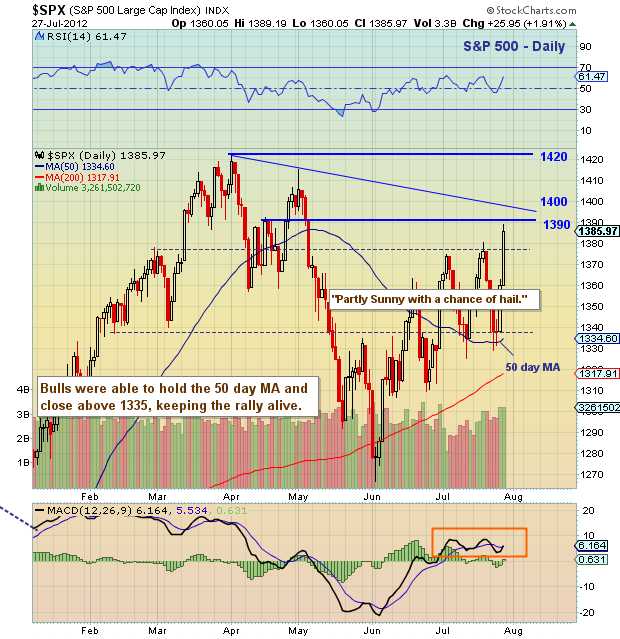
Is it Déjà vu or Vuja de? Here we are again with another S&P 500 market update and it’s clear that the market is continuing its “partly sunny with a chance of hail” theme.
Last week, the storms came early and often, pushing the index down during the first half of the week. In fact, by Wednesday, sentiment had gotten pretty dreary and few were ready to give the index a chance as it neared its 50 day MA. Understandable, though, as the index has spent the better half of the past two months up 5 days, down 5 days, rinse and repeat.
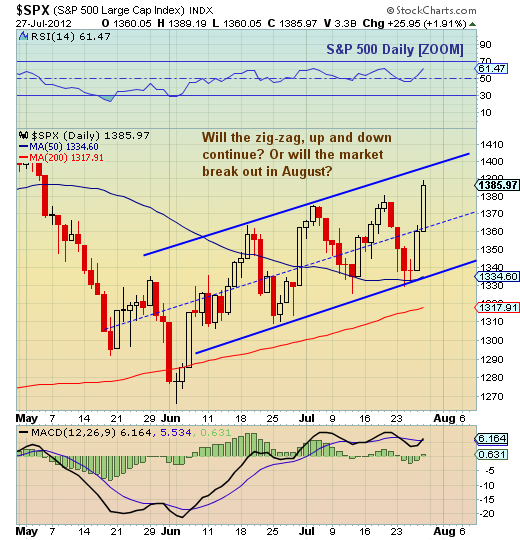
This has created a tough market for retail investors as well. Headline risk, earnings reports, and general economic uncertainty have caused quick, wild shifts in market sentiment that have epitomized, and paved the way for, the current zigzag higher. It’s definitely not been a market for big macro calls, unless your time horizon is 5 days. But, that said, it has afforded traders some very good opportunities if they are nimble and focused on the technical levels.
Turning our attention to the technical charts, it is notable that the S&P 500 broke above key lateral closing resistance at 1375. And furthermore, wasted little time thereafter reaching up to touch another important resistance level at 1390. If month end momentum continues into August and carries the index through 1390 next week, then the next block of resistance starts around 1403 on up to the spring high of 1422. Previous resistance around 1375 is now [the first level of] support.
As we look to the week ahead, there are three other factors to consider:
1. The market zigzag and rising channel, watching the upper end. See the daily ZOOM chart.
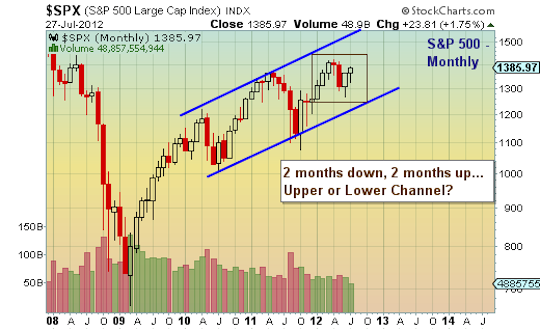
2. The macro market channel and zigzag on the monthly chart; it’s now coiling and indicating a larger move to the top or bottom of the channel is imminent.
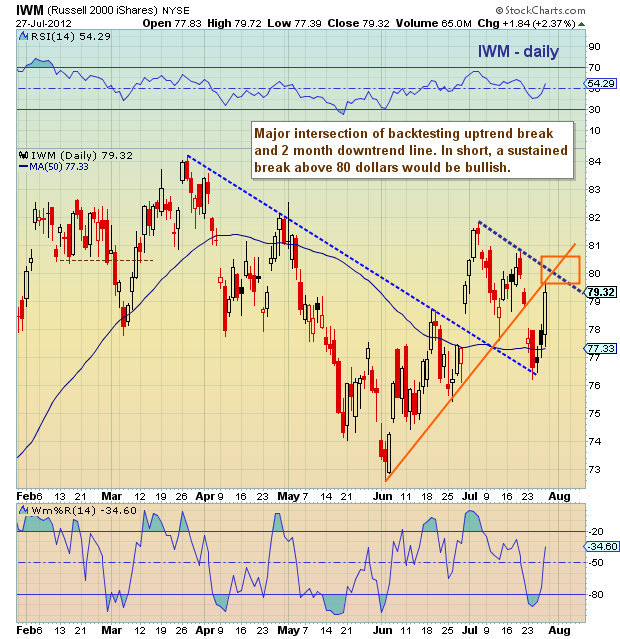
3. The Russell 2000 iShares (IWM) is nearing an important confluence of resistance around 80.00-80-25. Small Caps are often an important sign of market health, so investors would like to see the Russell confirm any move higher by sustaining a move through this level. See chart below.
Trade safe and good luck in the week ahead.
S&P 500 Daily Chart:
S&P 500 Daily ZOOM Chart:
S&P 500 Monthly Chart:
Russell 2000 (IWM) Chart:
Twitter: @andrewnyquist and @seeitmarket Facebook: See It Market
No position in any of the securities mentioned at the time of publication.
Any opinions expressed herein are solely those of the author, and do not in any way represent the views or opinions of his employer or any other person or entity.


