Every time the stock market reaches a potential price resistance area, the bears come out… and don’t get it done.
Every time the stock market is hit with negative news, it fights back.
Case in point: The S&P 500 Index looked poised to finally begin a meaningful pullback after the March jobs report released April 5th. But that pullback was halted by a big rally this past Friday that closed at new multi-week highs.
This has been a relentless bull wave higher off the December 24 lows.
I can’t blame the bears, especially here in April – the market is getting over-extended. But the market doesn’t care what we want or think will happen. The market doesn’t care about the bulls (see several past corrections and bear markets) or bears (see pattern of new all-time highs).
Today, we’ll take a quick peak at the daily and weekly charts for the S&P 500 and offer up a few thoughts.
Note that the following MarketSmith charts are built with Investors Business Daily’s product suite.
I am an Investors Business Daily (IBD) partner and promote the use of their products. The entire platform offers a good mix of technical and fundamental data and education.
S&P 500 “Weekly” Chart
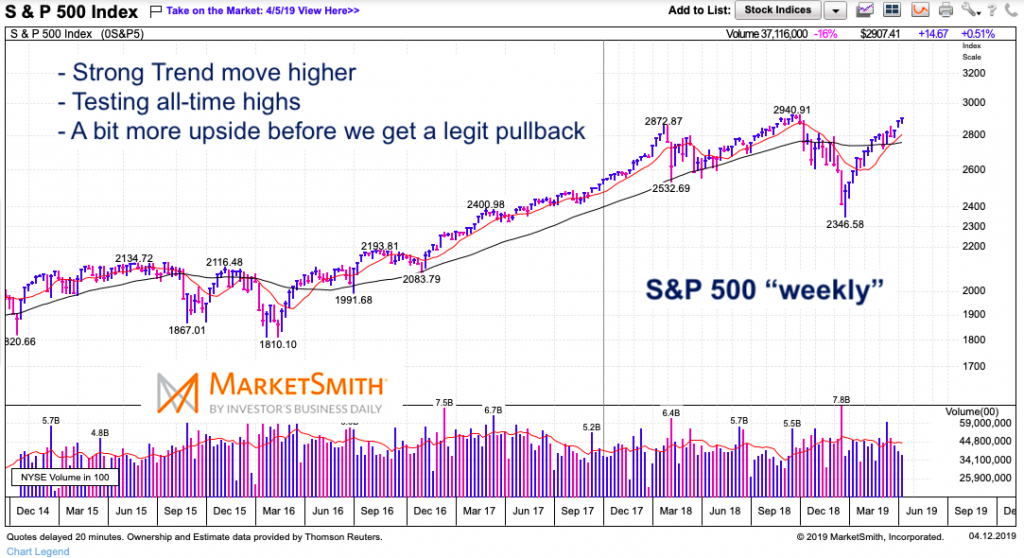
As you can see on the weekly chart, that’s a lot of positive price bars off the December lows. It’s taken the shape of a V bottom, exciting the bulls.
But with the all-time highs sitting overhead, the S&P 500 will need to chew through that resistance.

S&P 500 “Daily” Chart
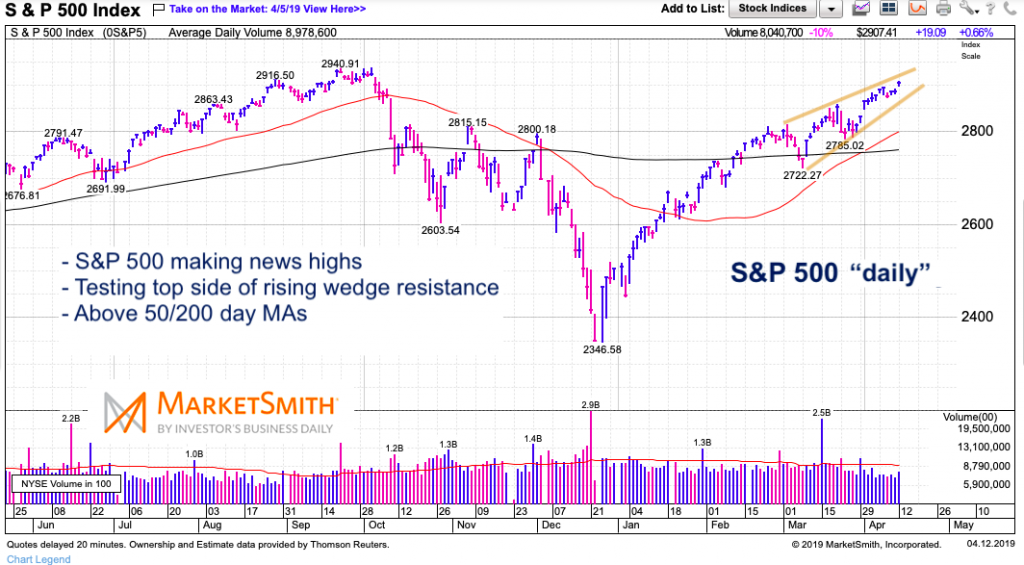
If you’re a bear, you are watching this rising wedge… and the wedge support line. If that breaks, the odds are likely that we see a 3-5 percent pullback.
But right now, the bulls are in charge until the technicals (price) tells us differently.

Twitter: @andrewnyquist
The author has a position in mentioned securities at the time of publication. Any opinions expressed herein are solely those of the author, and do not in any way represent the views or opinions of any other person or entity.
12:19 am CT – Editor’s note: Added “Case in point” and updated jobs report date.


