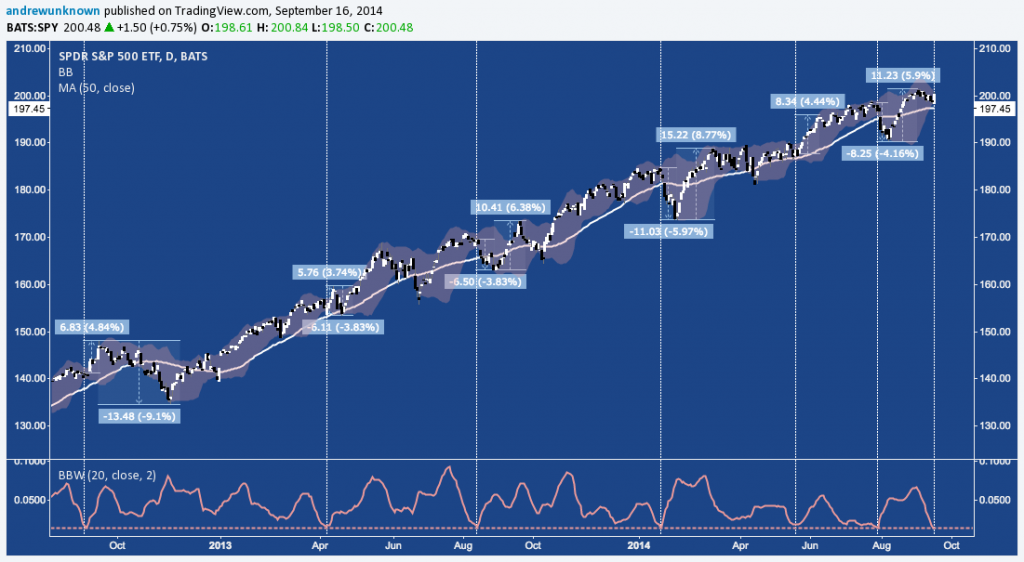
Despite – or rather, because of – Tuesday’s pop, a widely followed measure of volatility on the S&P 500 just printed it’s lowest value since January 4, 2007.
The SPDR S&P 500 ETF (SPY) Daily Bollinger Bands – a gauge of the standard deviation of the index’s closing value from a given (usually 20-period) moving average – closed today with a bandwidth of only .0143. This 7 year low – surprisingly lower than even Q2 2014’s period of zombie volatility – is indicative of how tightly the benchmark US stock index has been riveted to the 2000 (or 200) level since reaching and stabilizing near it in late-August.
However, as the last couple years demonstrate (shown below), periods of low realized volatility like this denote an unnatural calm in price that rarely lasts long (and hasn’t lasted this long in over 1750 market sessions). Periods of calm equilibrium set up and cleanly outline support and resistance boundaries from which price will break into disequilibrium, either resuming or reversing the previous trend.
SPR S&P 500 ETF (SPY) – Daily: Bollinger Bands Compression Points to Upcoming Volatility

In 4 of the 6 occurrences noted below, when SPY’s Daily Bollinger Bands reached a comparable level, the next 3-4 weeks saw absolute range installed of over 10%.
3 of 6 broke higher on the range expansion that followed (an average of 4.34%), with 2 of those 3 fully retracing the pop.
Similarly, 3 of 6 broken lower initially, averaging a decline of -4.65%. In all 3 cases, the SPY broke its 50-Day SMA (currently at 197.45), installing a well-defined set of two lower lows offering a buyable dip opportunity that was quickly snapped up, each time presaging new all-time highs on the index.
Twitter: @andrewunknown
Author holds no exposure to securities mentioned at the time of publication. Commentary provided is for educational purposes only and in no way constitutes trading or investment advice.


