Still at cabin, hunting quite difficult with 75 degree temps and humid. Rained all day today.
A cold front is coming in tomorrow so I will finally get some time in the woods. The timing of my trip was not good considering the weather AND the stock market.
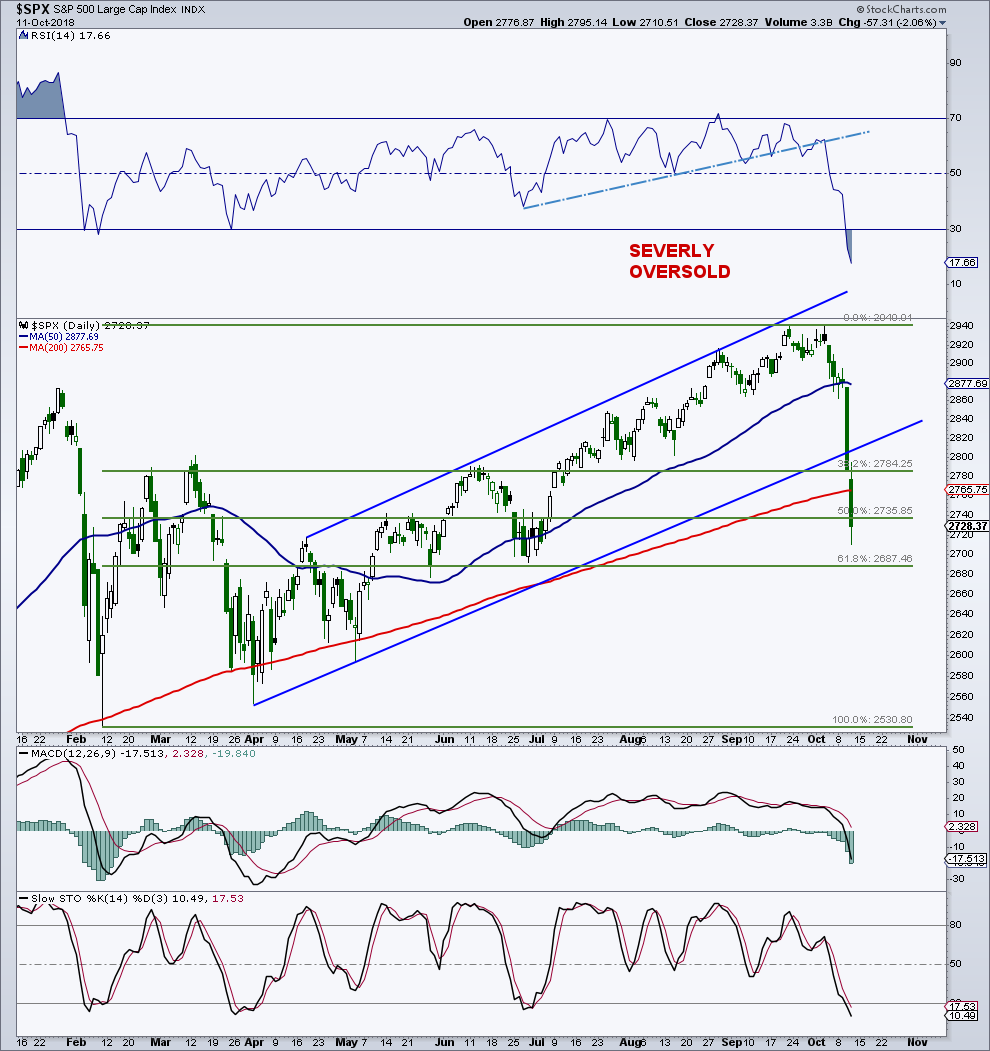
Clear panic later today as looks to be somewhat capitulatory. Extremely oversold, similar to August 2015, could see a bounce shortly. Will note some of the great rallies in a bull market start below the 200-day moving average.
S&P 500 “Daily” Chart with Fibonacci Levels
Will this support hold? If not, headed toward February lows?
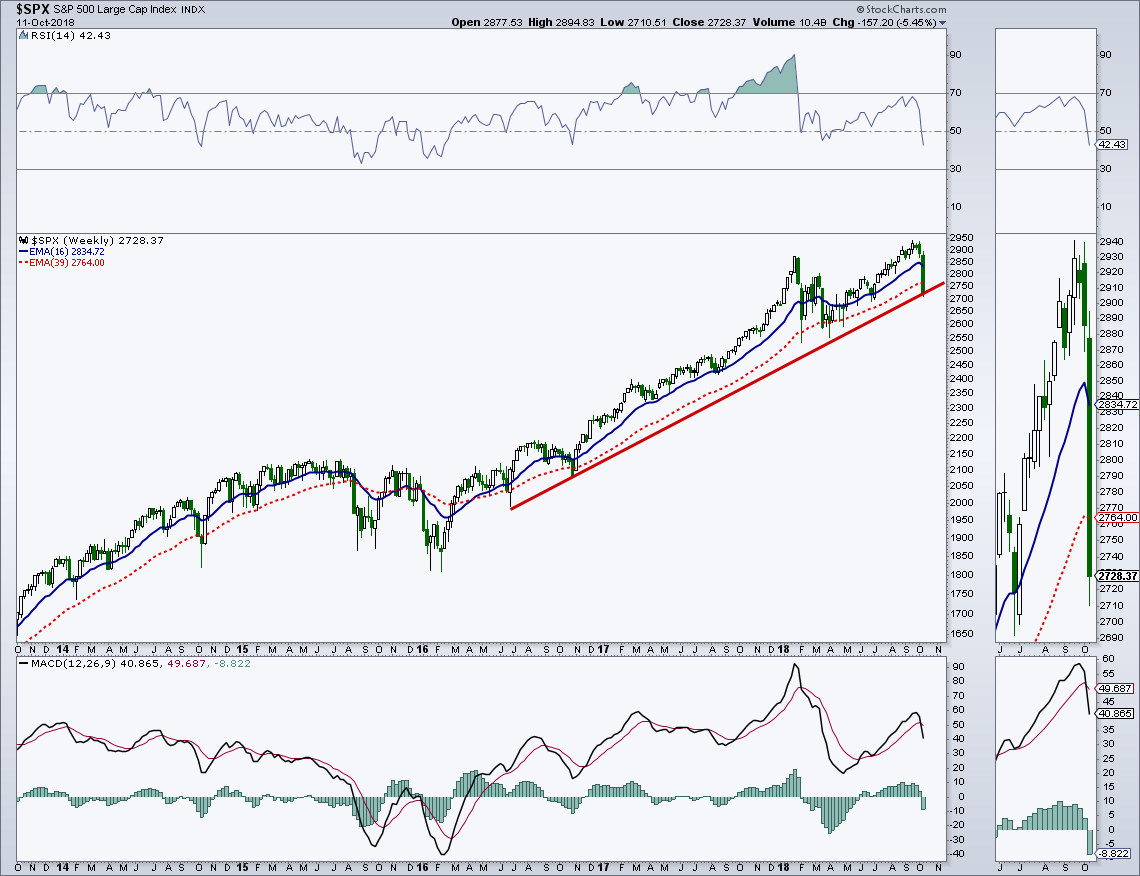
S&P 500 “Weekly” Chart – Trend Line
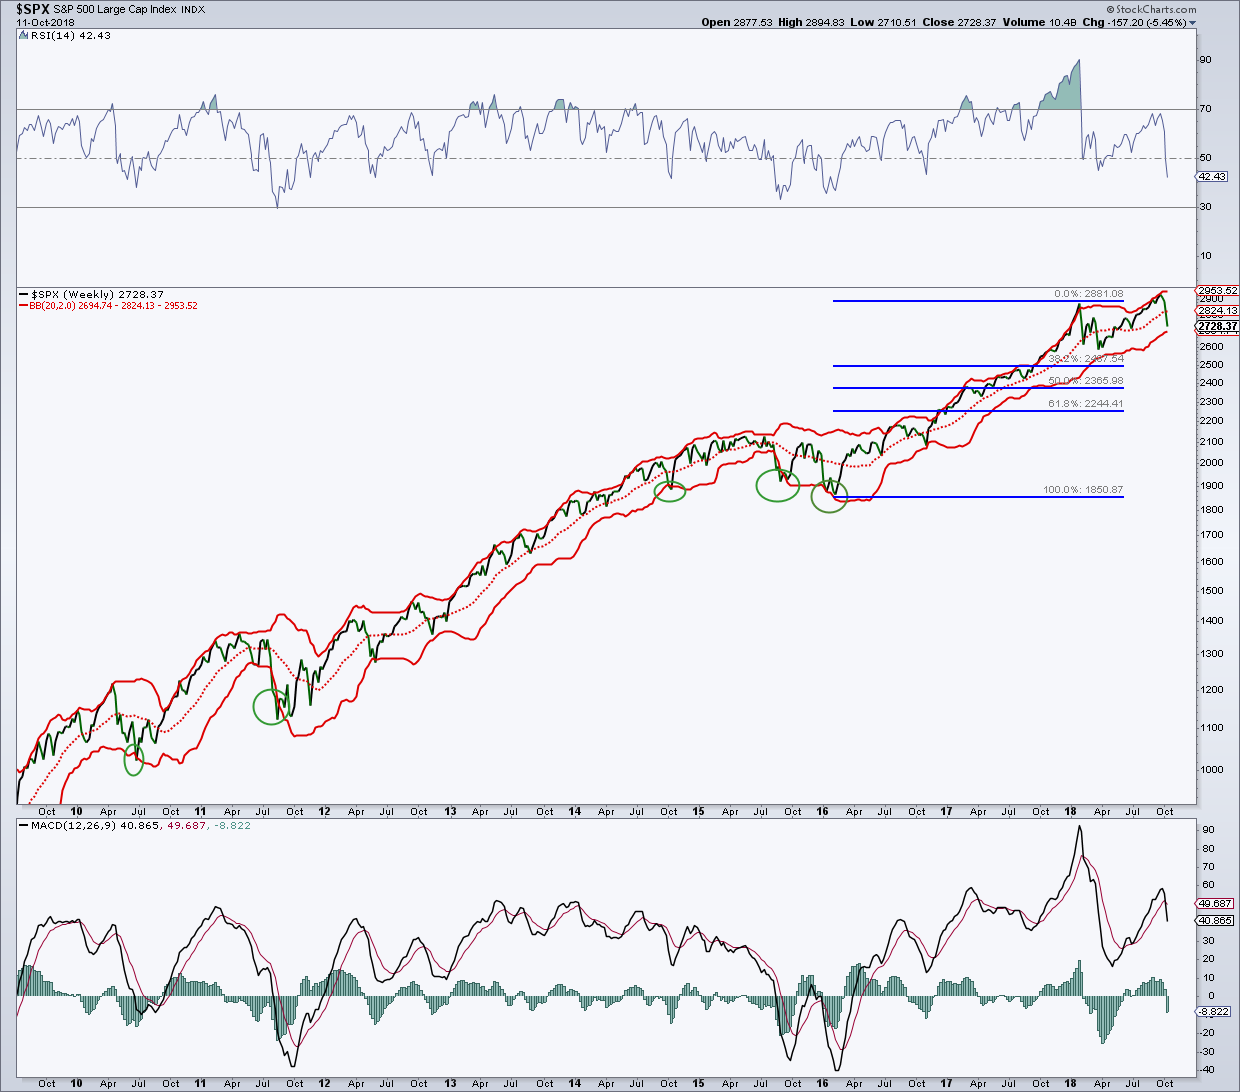
Headed to lower bollinger band? Best buys in a bull market are at/below weekly BB. Do not like 14W RSI below 50, where most damage takes place.
S&P 500 “Weekly” Chart – Fibonacci Levels
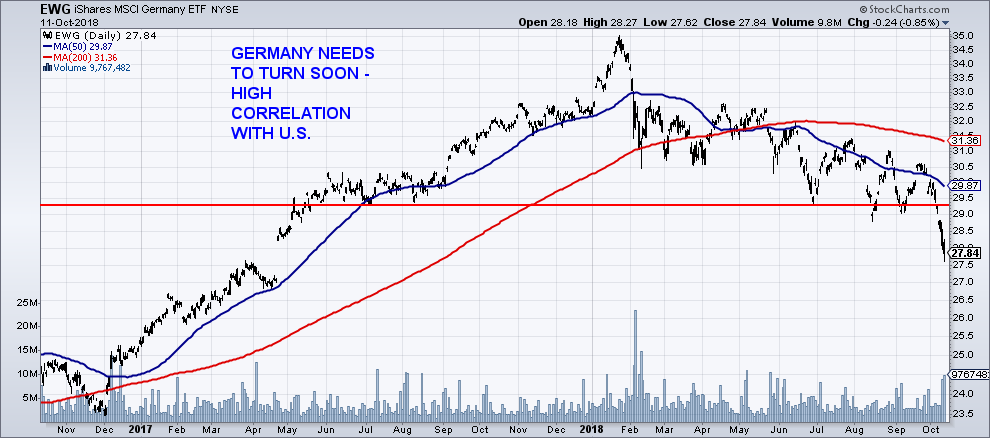
Do not like the action here. Talked about this months ago. Clear H&S breakdown. High correlation with U.S. equity markets.
Germany ETF (EWG) Chart
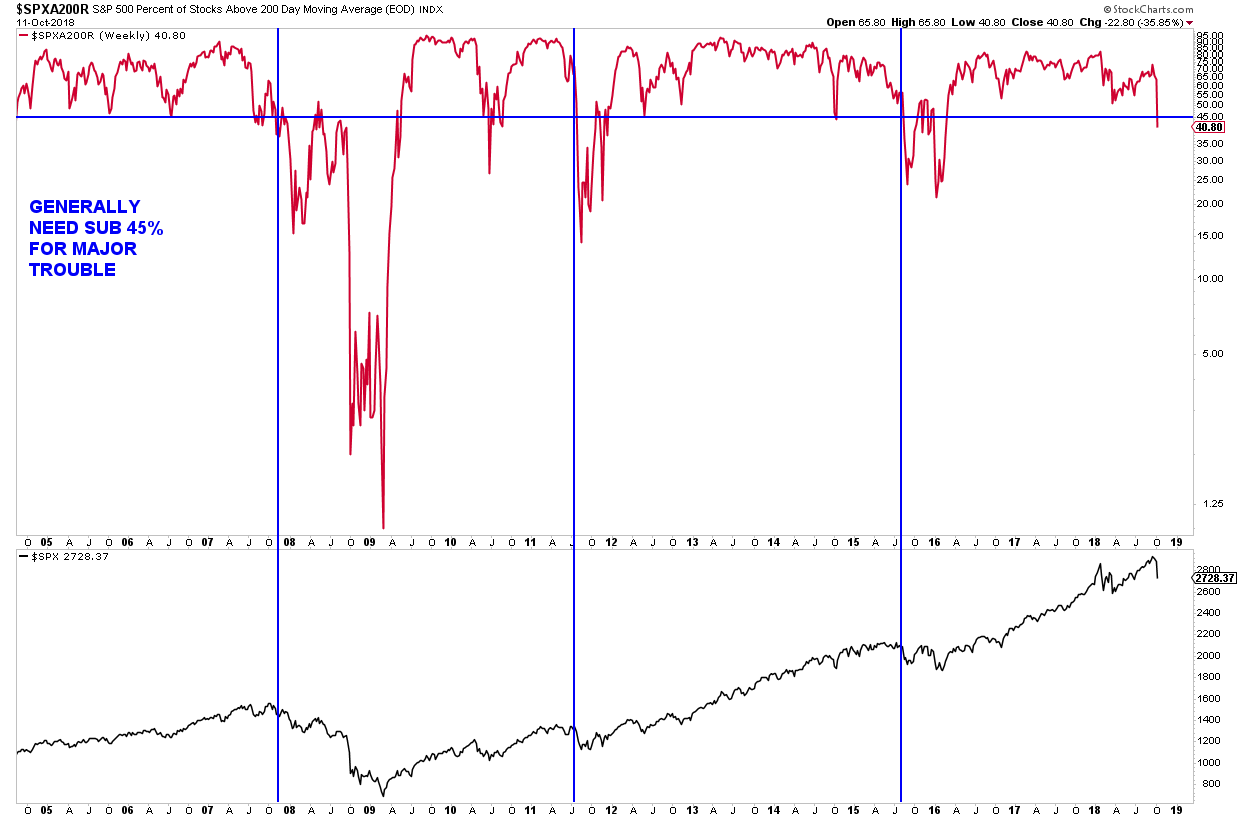
Do not like the sub 45% reading here. If does not recapture that level, trouble ahead.
S&P 500 “Market Breadth” Chart
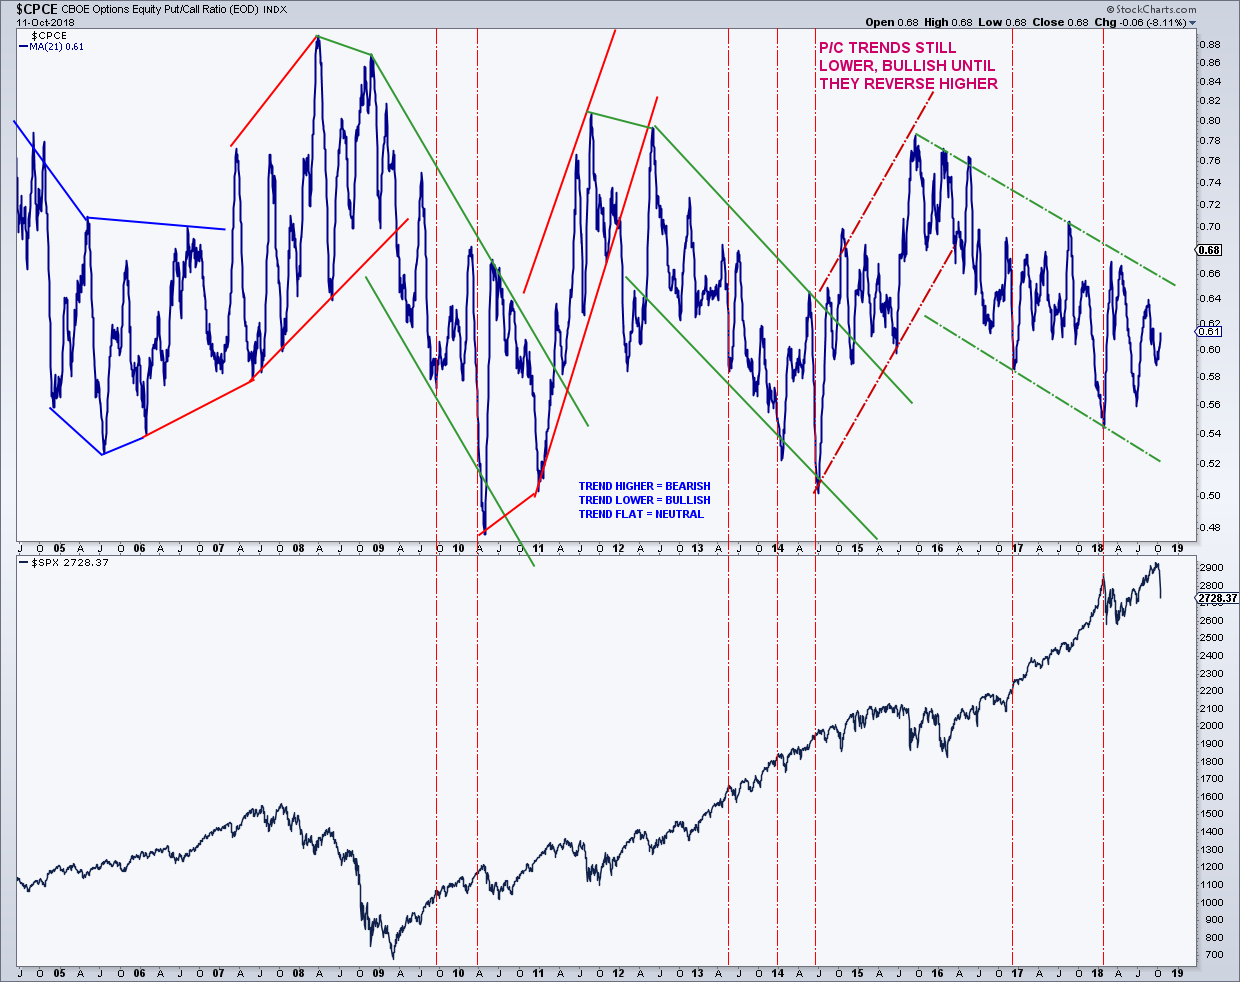
No sell signal here yet as long as downtrend continues.
Put-Call Trends
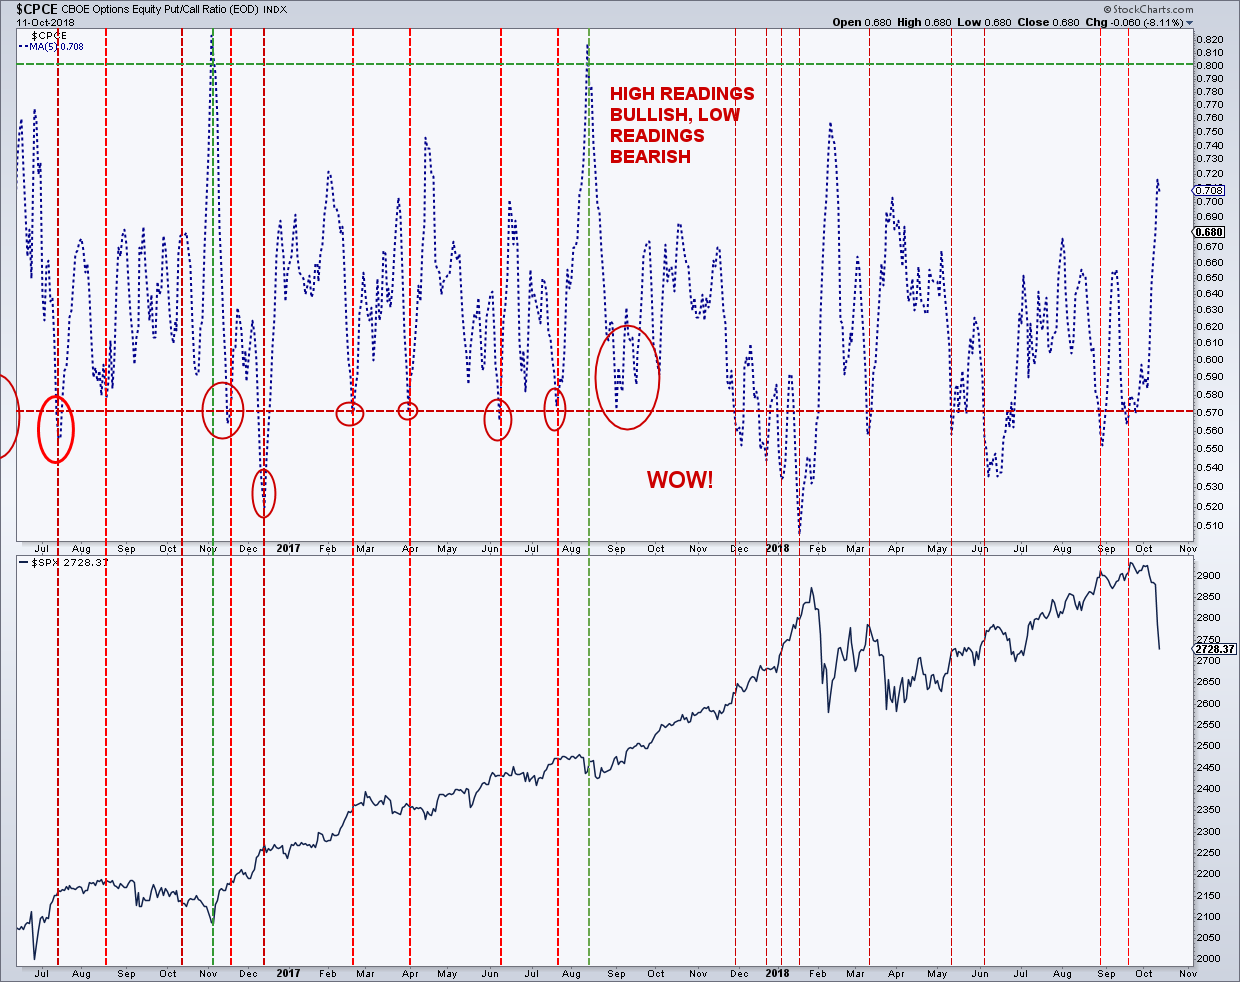
Would have expected more fear here after the second bad day. No buy signal was generated early this year.
Put-Call Chart
Feel free to reach out to me at arbetermark@gmail.com for inquiries about my newsletter “On The Mark”. Thanks for reading.
Twitter: @MarkArbeter
The author has a long position in Platinum at the time of publication. Any opinions expressed herein are solely those of the author, and do not in any way represent the views or opinions of any other person or entity.

