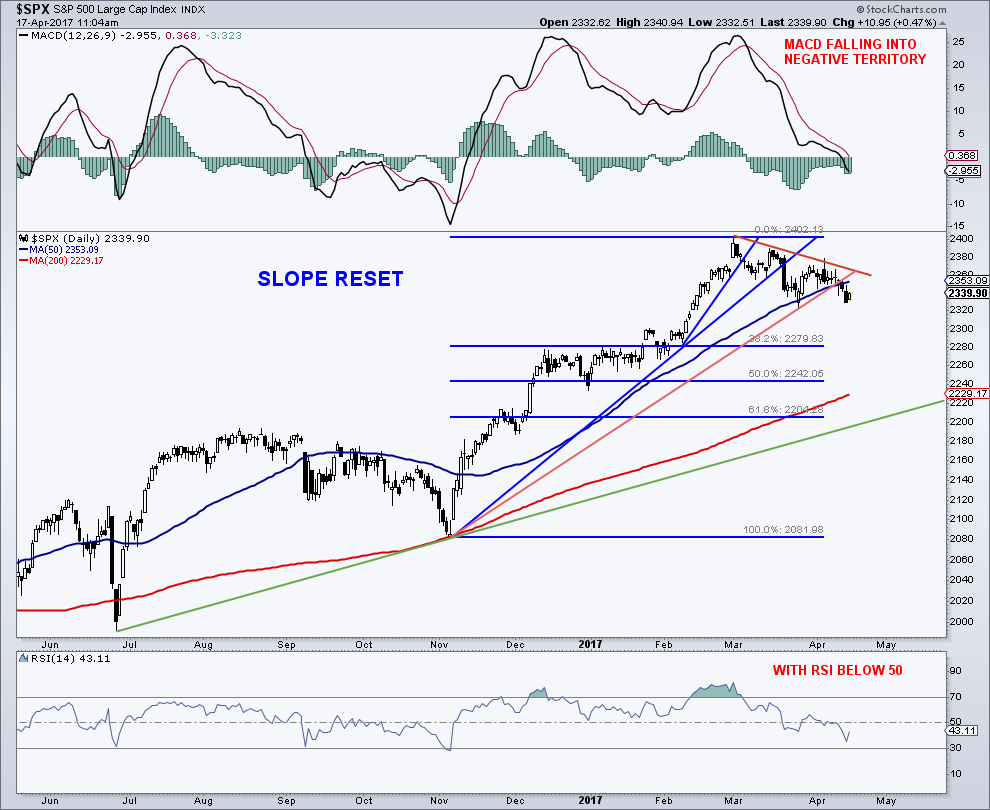
The choppy price action on the S&P 500 (INDEXSP:.INX) continues… Prices reversed higher today following a rough week that saw the index close on its lows.
So is a bottom near?
Here are a few things that I am watching:
1. MACD / RSI / 50 DMA
A couple of bearish developments occurred last week: the daily MACD moved into negative territory while the 14-day RSI fell below 50. As well, prices slipped below the 50-day moving average. These momentum characteristics tend to coincide with the “meat” of a decline. The rally today may test the bears fortitude. Stay tuned to these developments this week…
2. Slope Resets
Notice how many times the slope has reset during this pause/pullback. This is very typical after a strong move that becomes unsustainable from a slope perspective.
3. Buy Levels (support)
I have been recommending a small buy (an increase in equities to those that are underweight) at the 50-day average, followed by a larger buy down in the 2,280 to 2,300 zone. The next attractive buy area would be the 2,230 region (200-day average/chart and FIBO support).
Once the pullback ends, the upside reversal will likely be sharp so I find it easier to buy on the way down at specific and laid out support areas.
S&P 500 Daily Chart
Feel free to reach out to me at arbetermark@gmail.com for inquiries about my newsletter “On The Mark”. Thanks for reading.
Twitter: @MarkArbeter
Any opinions expressed herein are solely those of the author, and do not in any way represent the views or opinions of any other person or entity.


