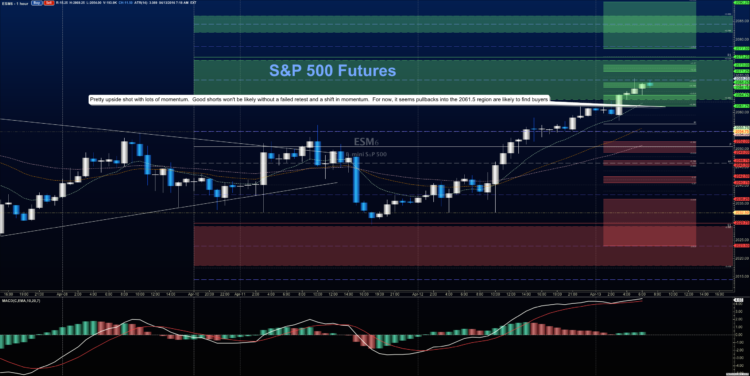
The monster bounce overnight for S&P 500 futures has the market in new highs territory on April 13. This move is still within a defined rangebound market, however, a breach and successful retest of 2070 could lead to further extensions in price.
At the same time, a failure could move stock market futures back into congestion.
On the upside, an extension in S&P 500 futures higher could see 2078.25 to 2082.5. Thus far, we seem to have higher support regions near 2053 to aid this move.
The mixed momentum across stock market futures suggests that levels will be still tested several times before resolution upward.
Momentum on the four hour chart reversed and is now positive; we are sitting at resistance near 2068. Buyers continue to save the day with deep traces south, like yesterday, but sellers were moved out of the way in the latest move.
Shorter time frame momentum indicators are positive into resistance that now looks like 2071.5 for now. With momentum readings like this, pullbacks into support will be bought.
See today’s economic calendar with a rundown of releases.
THE RANGE OF THURSDAY’S MOTION
Crude Oil Futures (CL_F)
EIA Report out at 10:30am. As the OPEC meeting looms ahead this Sunday in Doha, our crude oil chart continues upward – fueled by the news that Russia and Saudi Arabia have come into a oil production curtailing agreement. Recent OPEC report released this morning shows flat demand into the future. The crude oil futures chart remains quite bullish suggesting that pullbacks into support or prior congestion will be bought. Traders should be trading into the Doha meeting.
Today, the trading ranges for crude oil are 40.02 -42.9. Key price support is now near 41.01 – key near term price resistance near 42.2.
Moving averages in oil are bullish to mixed on tighter time frames, so we should see a bit of range bound activity into the EIA report. API showed a 6.2mm build, and we’ll be watching the move at the 10:30am report.
Intraday long trading setups for crude oil suggest a long off a 41.67 positive retest (check momentum here), or 41.07 positive retest on the pullback into targets of 41.35, 41.54, 41.84, 42.08, 42.2 and if buyers hold on, we’ll see 42.5 to 42.89.
Intraday short trading setups suggest a short below a 41.25 failed retest, or the failed retest of 42.16 (with negative momentum prevailing) sends us back through targets at 41.8, 41.58, 41.37, 41.24, 41.02, 40.9, 40.62, 40.39, 40.14, 39.84, and 39.2, if sellers hang on.
Have a look at the Fibonacci levels marked in the blog for more targets.
E-mini S&P 500 Futures (ES_F)
Below is a S&P 500 futures chart with price support and resistance trading levels for today. Click to enlarge.
The S&P 500 futures levels between 2068- 2073.5 are serving as front-line price resistance – if buyers take hold we could see 2076.5 to 2082.5. Front-line support sits near 2057.4.5- 2061.5 region. The buyers have been certainly empowered by the drift upward here, but the breach of resistance (which looks quite likely is one to watch).
Upside motion for S&P 500 futures has the best setup on a positive retest of 2061.75 or a breach and retest of 2067.5 with positive momentum. I use the 30min to 1hr chart for the breach and retest mechanic. Targets from 2061.75 are 2065.75, 2067.25, 2070.5, 2071.5, 2074.25, 2078.25, 2081, 2082.5, 2085.5, and if we can catch a bid there, we could expand into 2087.75. Long action is still trending over the bigger picture for now, and momentum is holding steady in trending territory.
Downside motion opens below the failed retest of 2058.5 or at the failed retest of 2071.5 with negative divergence (careful here- watch for the higher low to develop to tell you that an early exit might be necessary). Retracement into lower levels from 2065.5 gives us the targets 2061.75, 2058.5, 2056.25, 2053.75, 2050.75, 2047.5, and perhaps 2045.5 to 2042.5. Buyers should still come to the rescue at the deep support.
Have a look at the Fibonacci levels marked in the blog for more targets.
If you’re interested in the live trading room, it is now primarily stock market futures content, though we do track heavily traded stocks and their likely daily trajectories as well – we begin at 9am with a morning report and likely chart movements along with trade setups for the day.
As long as traders remain aware of support and resistance levels, risk can be very adequately managed to play in either direction as bottom picking remains a behavior pattern that is developing with value buyers and speculative traders.
Thanks for reading.
Twitter: @AnneMarieTrades
The author trades stock market futures every day and may have a position in mentioned securities at the time of publication. Any opinions expressed herein are solely those of the author, and do not in any way represent the views or opinions of any other person or entity.


