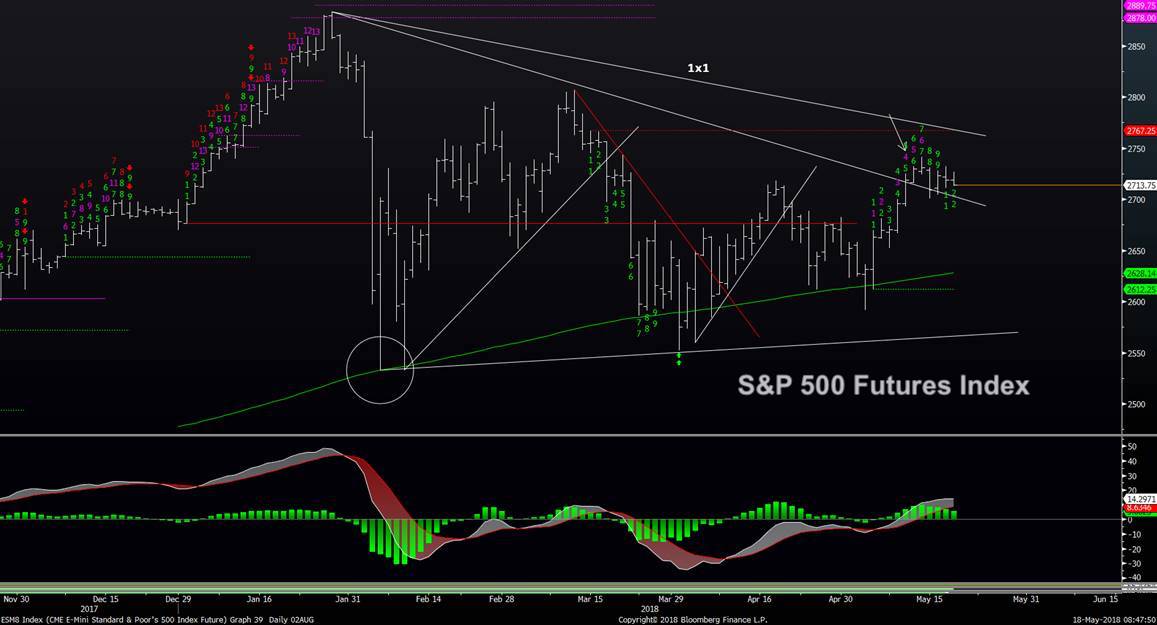
S&P 500 Trading Outlook (1-2 Days): MILDLY BEARISH
Tough call here on a 2-3 day basis as US equities have been sideways for five days.
That said, bond yields are breaking out around the globe and Technology continues to underperform.
Many cycles pinpoint mid-June as being important, which i believe should be a low. S&P 500 should have strong resistance near 2730-41, and under 2700 would give conviction for the bear case.
S&P 500 Futures Chart
Broad Market Analysis & Commentary
Many don’t seem to be taking the bond move all that seriously, but we’ve seen a fairly major breakout in yields across most timeframes, not just in the US, but also abroad. Bunds, Gilts have turned sharply higher coinciding with US yields spiking, and yesterday’s move in the 30-year looks meaningful and has the potential to extend sharply in the short run. So near-term, its not the stock market bringing excitement, but the bond market.
Whether or not this will bring about a selloff in stocks is difficult to say, but much likely depends on how sharply rates move in the days ahead. Credit spreads haven’t really budged lately, which is encouraging, but yet might start to widen out if/when implied volatility turns higher meaningfully which could be right around the corner. Sentiment doesn’t make the case for much of a lengthy selloff by any stretch, as CFTC data shows Speculators being more short in Treasuries than we’ve seen in at least the last 10 years. Therefore, this likely equates to just a near-term sharp bond selloff that proves short-lived and should be buyable come early June (yields rise initially but then could pullback from June-September) The technical make-up of most charts however, shows this to be a meaningful move, not just in 5 and 10-year yields, but a very bullish Cup and Handle style base in the 30year (yes, still very much relevant) that has been exceeded as of yesterday.
So my expectations are for sharply higher yields over the next 5-7 days. Whether or not this serves as a trigger or not, is difficult to say, but chart breakouts of some of the bearish Treasury ETFs like TBT suggest this can still likely gain ground in the week(s) ahead.
Sector-wise, we did see attempts by the large-cap weighted Industrials ETF (XLI) to break out of its downtrend from late January. But yet again, Financials underperformed and were down on the day while the late day selloff in NASDAQ also looked to be a concern and largely offset the bullish moves in Small-caps or Industrials. Given that Healthcare (XLV), Industrials (XLI), Financials (XLF) have been in downtrends, it just doesn’t give much confidence to trust this tape right now, particularly given the low Equity Put/call ratios which have been hovering in the 50’s. (roughly 2 calls bought for every put)
It seems like investors are concentrating on the index breakouts, while ignoring some of the key sectors to this market which certainly have not been participating in a way that’s all that inspiring. The next couple weeks should shed some light as to whether large caps can rally to join the party we’ve seen lately with Small-caps, and for the bullish case, ideally XLF needs to get over $29 while seeing XLV eclipse 84.50 and XLK exceed $71.34. That seems like a tall order between now and late May.
If you have an interest in seeing timely intra-day market updates on my private twitter feed, please follow @NewtonAdvisors. Also, feel free to send me an email at info@newtonadvisor.com regarding how my Technical work can add alpha to your portfolio management process.
Twitter: @MarkNewtonCMT
Author has positions in mentioned securities at the time of publication. Any opinions expressed herein are solely those of the author, and do not in any way represent the views or opinions of any other person or entity.


