S&P 500 Trading Outlook: Bullish… IF we breakout to the upside.
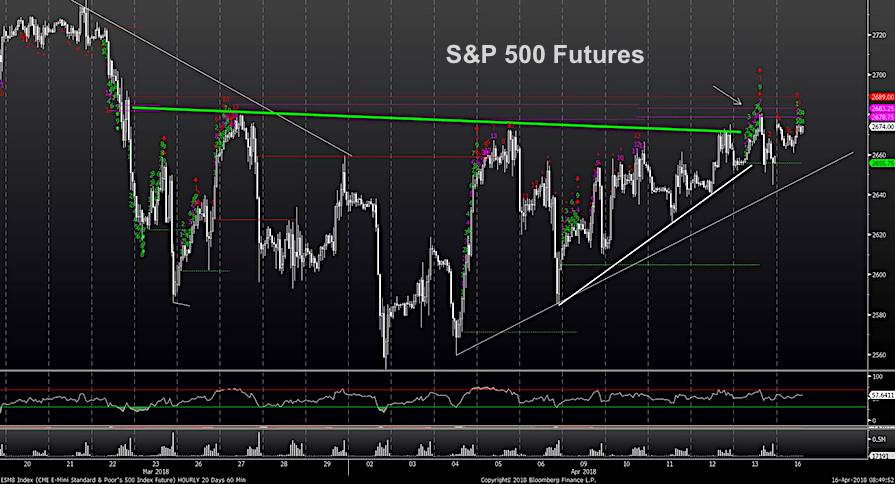
We are still hovering around last Friday’s highs… but the pattern is still quite constructive for a push up over 2700 early this week.
Above 2680 on futures has little resistance until over 2700. So breaking above last Friday’s highs will be key.
Only a move down UNDER 2644 will violate this trend from early April. It would take a move under the late Friday intra-day lows to grab our attention/concern. Right now there is insufficient damage to consider shorting or avoiding equities given the current structure.
Stock Market Timing Cycles
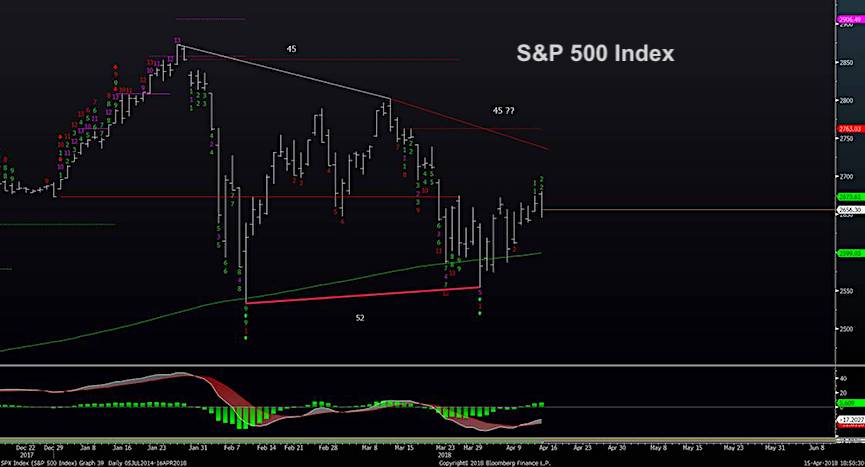
Time wise it’s always important to look at 45 day and 90 day calendar cycles from former highs and lows. The initial peak when projecting 45 days gave us mid-March. Now another would focus on late APRIL for another PEAK in prices which then likely would lead lower. Notice that a 45 day cycle from the 2/9 lows DID pinpoint lows Friday-23rd/Mon 26th but was undercut by a small amount into 4/2, so we’ll utilize the 52 day count. Taking HALF this length… 26 days… from April 2… often important (38.2%, 50%, 61.8%, 100%) of low to low counts often important (or as Gann did.. utilizing 1/8’s) helps us arrive also at late April for a peak in prices and/or meaningful turn. Also note 4/20 lines up with important peaks from 2016 and mid-April also was important last year. Bottom line. Were looking for a rally this week, but would turn a bit more cautious into next week
If you have an interest in seeing timely intra-day market updates on my private twitter feed, please follow @NewtonAdvisors. Also, feel free to send me an email at info@newtonadvisor.com regarding how my Technical work can add alpha to your portfolio management process.
Twitter: @MarkNewtonCMT
Author has positions in mentioned securities at the time of publication. Any opinions expressed herein are solely those of the author, and do not in any way represent the views or opinions of any other person or entity.


