Whoa, the stock market is on fire this week. Just 3 days into the last week of the month, and the S&P 500 (NYSEARCA: SPY) is up 4.22% this week.
The broad market index is also up 1.2% on the month, reversing a nearly 3 percent loss in a matter of days.
It’s fair to recognize that the sharpest rallies often come in downtrends (or when exiting downtrends).
I guess that is the dilemma savvy investors face…
Is this a fast and furious rally that will vanish with in a week? Or the start of something bigger?
Note that the MarketSmith chart shown below was built with Investors Business Daily’s product suite. I am an Investors Business Daily (IBD) partner and promote the use of their products – you can gain access here. It’s a great platform with a good mix of technical and fundamental data.
S&P 500 Short-Term Considerations
Looking at the chart below, I see a few items of business that the bulls and bears have to sort out.
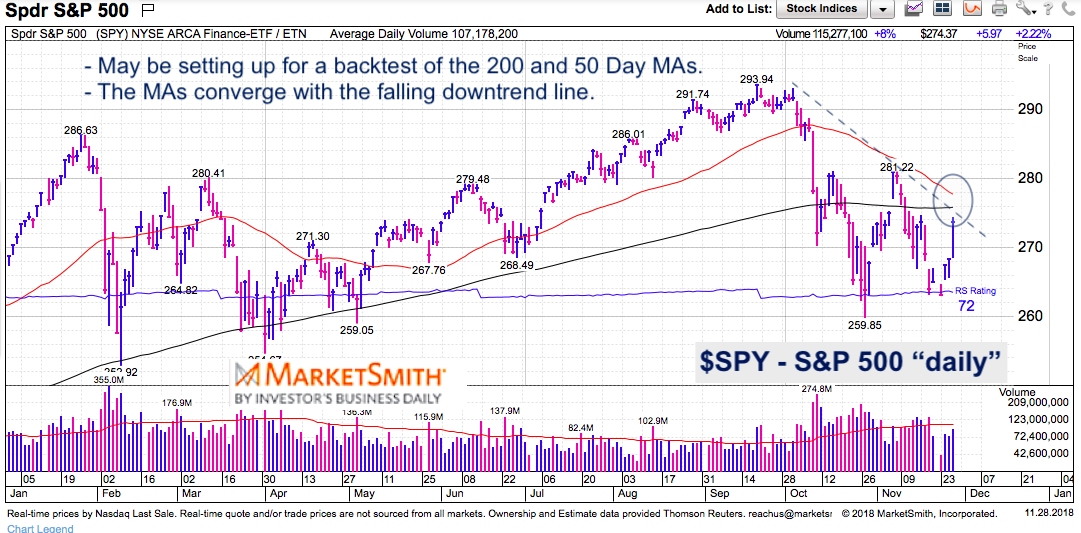
1. The 61.8% Fibonacci retracement of the November 7th highs to November 23rd lows is 2645 (just two points higher than today’s close). Eclipsing this mark would be a small foothold for bulls facing a steep climb. $SPY (the ETF) closed just above its 61.8 mark. Eyes on tomorrow’s close. Again, for starters…
2. The 200 day moving average and downtrend line are next.
3. The falling 50 day moving average bears more importance. It was punctured, recaptured and broken in early October. It was retested in early November… and may be retested yet again in early December. The 200 day MA is converging with the falling 50 day MA. This makes the price resistance area more formidable… and even more important should the bulls break out above it.
S&P 500 ETF (SPY) “daily” Chart
Have a plan and stay focused.
Twitter: @andrewnyquist
The author has long exposure to $SPY and $DIA at the time of publication. Any opinions expressed herein are solely those of the author, and do not in any way represent the views or opinions of any other person or entity.


