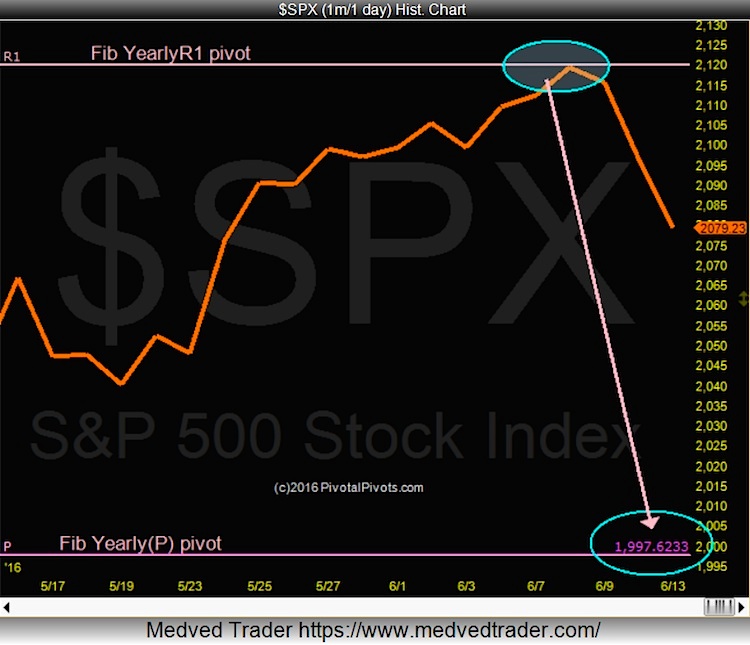
Just when everyone and their dog was getting bullish about retesting the all time highs, a pullback begins to take shape. Happens every time. This is why I block out the noise and focus on the S&P 500 trading pivots (along with pivots for other major indices and stocks).
The high so far on S&P 500 index in 2016 is at the YearlyR1 Fibonacci Pivot Point. This calculation is different than a standard Fibonacci retracement or extension. Simply google “Fibonacci pivot points” for more info.
Since the S&P 500 Index failed to close above the Fibonacci YearlyR1 Pivot Point, I see potential risk of a bigger pullback down to the Fibonacci and Floor Traders Yearly(P) S&P 500 trading pivot point at 1997. When these happen I call them “Pivot Price Patterns”. This action brings lower price targets into view…
The key level on the S&P 500 that I was watching heading into today was 2075. This level is currently breaking down (note the chart is through yesterday’s close. A break below 2075 opens the door for a 2047 price target in June and possibly the S&P 500 trading pivot at 1997 by mid-July.
On the other hand, if we see a swift reversal back above 2075 today with follow through, then we may see a 2125 price target by the end of June.
Thanks for reading and have a great week.
More From Jeff: S&P 500 Pivots Lead The Way For Traders
Twitter: @Pivotal_Pivots
The author may have positions in related securities at the time of publication. Any opinions expressed herein are solely those of the author, and do not in any way represent the views or opinions of any other person or entity.


