S&P 500 Trading Outlook (1-2 Days): Bullish OVER 2846, Bearish Under
While some evidence of stalling out is at hand, we still haven’t seen weakness.
Thus, it’s tough to rule out another 3-4 days which would bring Demark counts to completion on S&P 500 Futures, NASDAQ and also VIX.
A decline is getting closer, and breadth is the guide. Upside may be limited, but good to wait for the break before assuming any short positions. Buying Implied Volatility makes sense for September.
Under 2835 will likely lead to a retest and break of 2800 and pullback to 2755. Similarly, breaks of 7600 and 7100 for NASDAQ comp and NDX would be important.
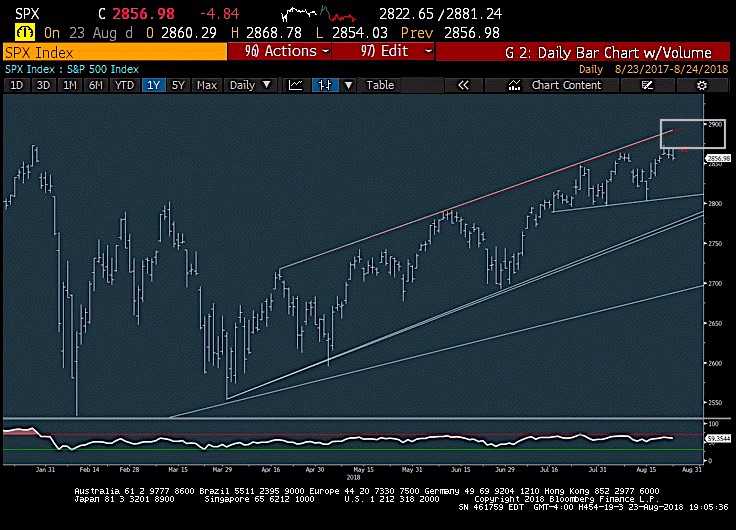
S&P 500 Chart (through 8/23 close)
Some definite evidence of stalling out, yet no real proof of a decline of any sort. Prices remain within striking distance of all-time highs in US indices like S&P 500 and NASDAQ, while other indices like IWM, SML, MID, TRAN have already accomplished this feat.
Breadth is starting to show evidence of withering as prices churn near the highs, while the back and forth nature of the rallies and declines intra-day is starting to bring about the feel of a very unstable market. Yet, the closing price tells all, and in this case, there still hasn’t been sufficient deterioration to think an immediate selloff is upon us. While upside for equities is limited, it still makes sense to play from the long side from a trading perspective until/unless 2846 is broken, Wednesday’s lows in September S&P Futures.
If you have an interest in seeing timely intra-day market updates on my private twitter feed, please follow @NewtonAdvisors. Also, feel free to send me an email at info@newtonadvisor.com regarding how my Technical work can add alpha to your portfolio management process.
Twitter: @MarkNewtonCMT
Author has positions in mentioned securities at the time of publication. Any opinions expressed herein are solely those of the author, and do not in any way represent the views or opinions of any other person or entity.


