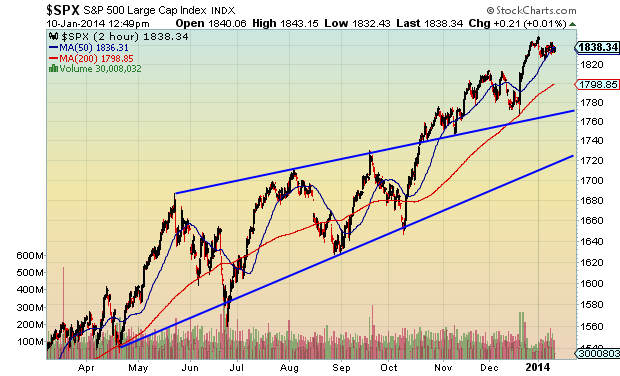
 With the S&P 500 churning for the past week or so, chatter has grown that a correction is in the offing. Now I definitely agree that a correction would be healthy, and likely is approaching, but I also abide by what my charts are telling me. As a “levels” guy, I trade into key price zones and monitor risk based on action in and around corresponding time frames. And remember, a correction tends to mean +5%… so some levels need to break before confirming more downside.
As I type, the index is less than one percent off all-time highs. BUT, considering the sideways action of the past week, active traders on both sides have reason to stay focused.
Below are some short-term S&P 500 technical support levels to watch:
- 1824 (Jan 6 lows)
- 1818 (.382 fib retrace)
- 1808-1813 (prior highs, .500 fib retrace)
- 1799/1800 (.618 fib retrace, round number)
A sustained move below 1808 would usher in some caution, and warn that this move may have room to run.
On the flip side, a move above 1840, would likely bring a retest of the highs. And new highs would be, well, new highs. Trade safe.
SPX “trader” view
SPX near-term wide angle
Author holds short exposure to the S&P 500 via SH as a trading hedge at the time of publication. Any opinions expressed herein are solely those of the author, and do not in any way represent the views or opinions of any other person or entity.


