Stocks remained resilient last week but the S&P 500 Index (INDEXSP:.INX) only eked out a 6 point gain.
This week things will start to get interesting as a new cycle looks to unfold.
Market Summary:
- The S&P 500 again moved higher last week, gaining 0.2%.
- Stocks chopped around during the week, as rumors about the forthcoming tax plan swirled, and the plan was ultimately released.
- Apple (NASDAQ:AAPL) beat Wall Street’s expectations for earnings and revenue and ended Friday up over 2%.
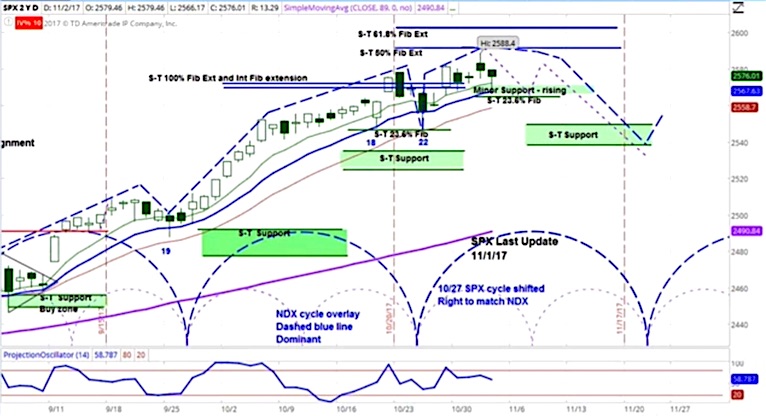
The stock market moved higher last week, with the S&P 500 (SPX) moving up 6 points to 2587, another new all-time high.
On Monday, the Russell 2000 Index (INDEXRUSSELL:RUT) was down over 1% as rumors surfaced that Congress was considering phasing in corporate tax cuts to limit the budget deficit. This would affect the smaller companies in the RUT to a greater degree, as they tend to have a larger share of domestic revenues.
On Tuesday, the Conference Board’s consumer confidence index reached its highest level since December 2000 with a reading of 125.9, exceeding expectations of 121.5. This indicator measures sentiment amongst consumers with respect to the economy and the job market.
On Wednesday, Automatic Data Processing (ADP) reported that the economy added 235,000 jobs in October, compared to expectations of 190,000. While the SPX had opened higher, it gradually sank throughout the day, ending with the Federal Open Markets Committee (FOMC) signaling no rate hike in November.
After the close, the market moved lower again, this time on rumors that the corporate tax cuts may not be permanent. On Thursday, the market sank on rumors surfaced that the tax cut plan would limit the mortgage deductions. But then it rose again once the plan was officially released.
After the close, Apple (AAPL) beat earnings expectations with $2.07 per share, compared to expectations of $1.87, and also beat revenue expectations. On Friday, the company began selling its 10th anniversary iPhone X. AAPL shares closed 2.61% higher at $172.50.
The Bureau of Labor Statistics released its October employment report on Friday, showing an increase of 261,000 jobs and unemployment dropping to 4.1%.
The accompanying chart of the S&P 500 shows our projection for this week: a move lower and then a move higher, as a new short-term cycle begins. The blue-dotted half circles at the bottom of the chart illustrate the short-term cycle patterns.
For more a more detailed look at cycle analysis for a broader selection of futures, watch the askSlim Market Week every Friday afternoon. Here’s my latest video:
Twitter: @askslim
Any opinions expressed herein are solely those of the author, and do not in any way represent the views or opinions of any other person or entity.


