 This is the question. Is there more rally ahead for stocks over the near-term? As a technical analyst, I prefer to follow price. So let’s see what investors are looking at today and in the days ahead.
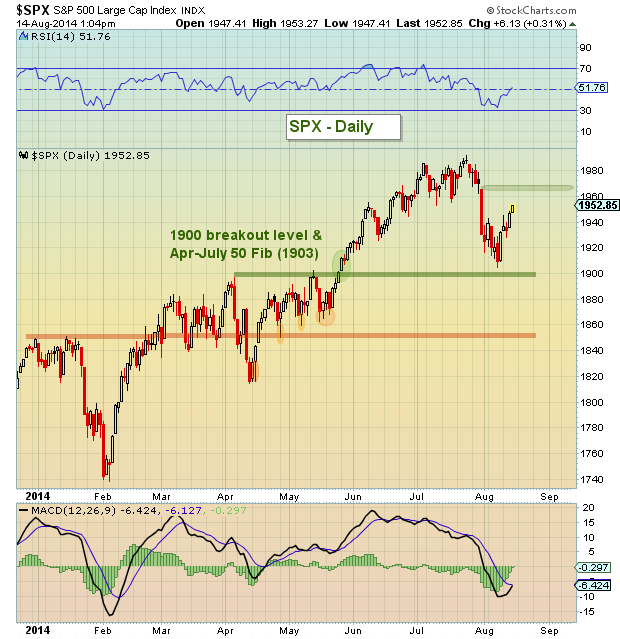
The bounce from 1900 wasn’t entirely unexpected; myself and other technicians had been eyeing that level for several days leading up to the overnight puncture of 1900 on the e-mini futures heading into Friday, August 8th. Back on August 7th, I highlighted the setup again in two notes:
$SPX – S&P 500 nearing 30 RSI. On bar 9 for daily setup. Feels heavy, but bounce may be near… https://stks.co/g0v02
— Andrew Nyquist (@andrewnyquist) Aug. 7 at 02:20 PM
$SPX – Would like to see a heavy compression close, perhaps with a puncture of 1900 to set up a bounce.
— Andrew Nyquist (@andrewnyquist) Aug. 7 at 02:22 PM
But that is only the half of it. Just a level for traders. So what will it take to push to new highs again. Well breaking 1944 on then S&P 500 was key to today’s move higher (thus far). A measured move would target 1965/70. This is also the open gap from the July 31st plunge. So, this is a level that the bulls need to take out to have a shot at new highs.
So what level would I be eyeing if we take out 1970? Well, first would be the old highs… but beyond that would be 2032 (Fib extension). I’ve been eyeing this for some time (Note that I mentioned this target in May in my Mapping The S&P 500 post (and again in June).
S&P 500 Daily Chart
BUT, the market is getting long in the tooth and fall seems ripe for some sort of a correction (either now if 1970 fails), or later after we reach up to new highs. So it’s probably good to keep your time frames in perspective.
Trade safe, trade disciplined.
No position in any of the mentioned securities at the time of publication. Any opinions expressed herein are solely those of the author, and do not in any way represent the views or opinions of any other person or entity.


