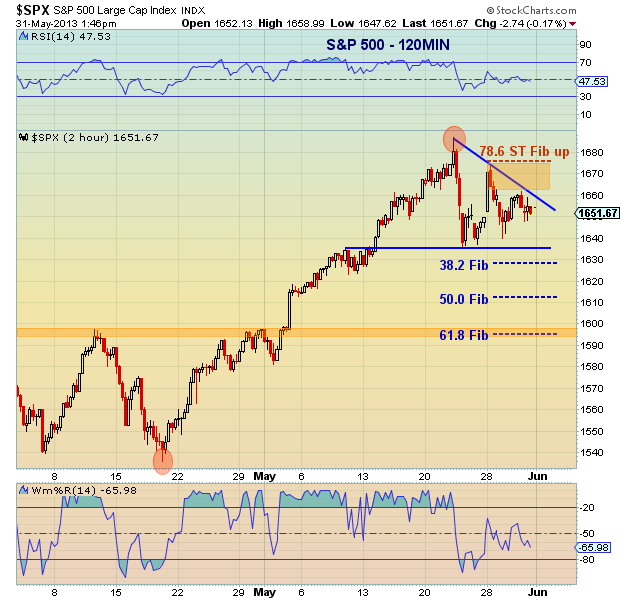
 As the S&P 500 toils just below all-time highs, stocks are exiting month end on a quiet note. Early in the week we saw a nice bump higher in the S&P 500 (which could have been a retest), but since then we have yet to see any significant strength. As well, the range is narrowing so investors should be aware of some key levels that will provide support and resistance going forward.
But before I get into the S&P 500 near-term chart update, let’s ponder a couple scenarios likely on traders and investors minds:
A) The S&P 500 is forming a short to intermediate term top
OR
B) The S&P 500 is consolidating for another run higher
I ask these questions because they cause us to think about the importance of particular levels of support and resistance (as well as time and price). In the chart below, it is clear that options A or B could be occurring as we speak. Therefore , the character of the price action over the next week or so will be important.
For option A to evolve, the market will need to accelerate through support (currently 1635) and hold below the 38.2 Fibonacci retracement at 1629 (caution). A correction would likely be confirmed by a break below 1594 (61.8 Fib); note this is also in line with the breakout at 1597 (also support). For option B to stay in play, support will need to hold and the sideways, rangebound chop stay in tact. As well, a move above 1675 (78.2 Fib up) would be constructive and indicate a full retest of the highs. Any move below 1629 will need to hold 1594-1597 (as mentioned above). Anything more than a quick shakeout below this level would be a red flag and add to overhead “supply” near-term.
S&P 500 Chart (near-term)
Thanks for reading this quick S&P 500 update. Trade safe, trade disciplined.
Twitter: @andrewnyquist and @seeitmarket
Author has a position in SH at the time of publication.
Please check us out on Alexa and feel free to provide a review with feedback.


