 There has been a significant slow down in market momentum over the past month or so. In fact, some investors would argue that 2014 has seen some notable deterioration with momentum and tech stocks getting hit hard, and blue chips showing strength. That said, it is important to follow the price action. And furthermore, until key S&P 500 technical support levels are broken, I’ll allow the bulls to hoard the punch bowl.
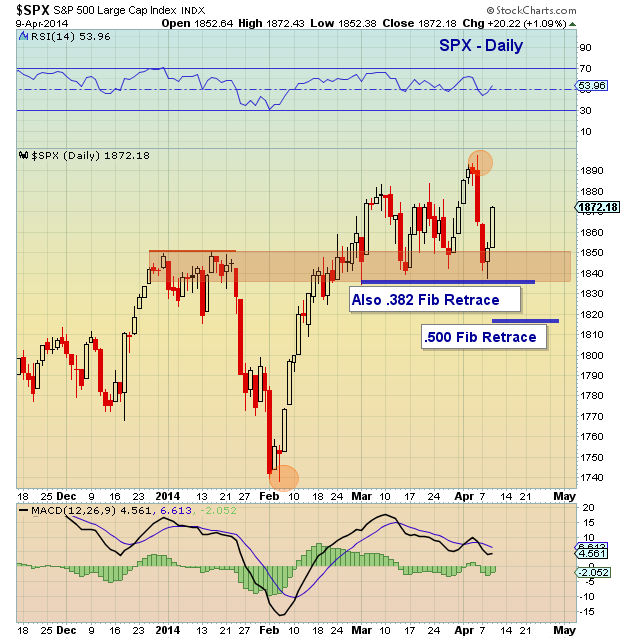
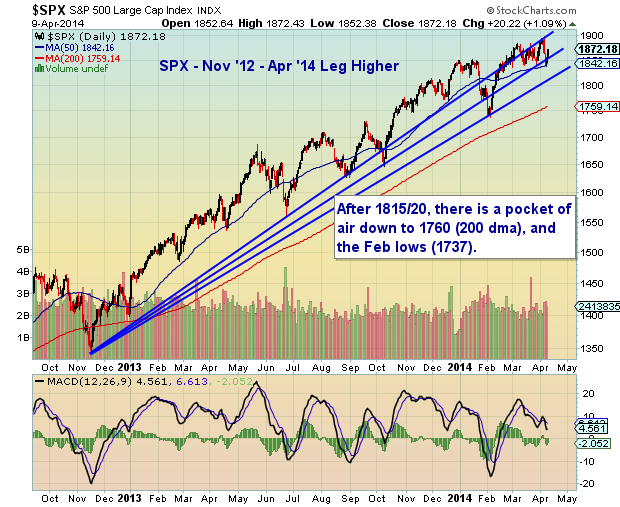
Below are a couple of charts that highlight the technical support levels that I am currently watching on the S&P 500. The first chart draws attention to a couple of key Fibonacci retracement levels. Note that the .382 Fib level corresponds to lateral support (as well as the recent lows). The second S&P 500 technical support level, which bears even more importance, is the .500 Fibonacci retracement level around 1817. A breach of this technical support level for more than a few trading hours would likely warn of a deeper price decline, perhaps to the 200 day moving average (currently at 1760) or the February lows (1737). Note that the uptrend array from November 2012 shows current trend support around 1815. See charts below.
S&P 500 Technical Support Levels – Daily Charts
On the flip side, key technical resistance resides at the recent all time highs. And because this level is near a big round number (1900), it’s likely to bear more psychological importance. Trade safe.
No position in any of the mentioned securities at the time of publication. Any opinions expressed herein are solely those of the author, and do not in any way represent the views or opinions of any other person or entity.


