The stock market correction went from sharp selloff to correction to panic in just 7 days.
The stock market correction has lopped off 15 percent in a little over a week and is threatening to become a very quick bear market.
Understanding this reality, today I take a quick look at some potential areas where the market may find support.
It’s important to understand that investors need to have a plan of action to buy into a market in free fall. Putting money to work in fractions is how I operate – this allows me to limit the emotional aspect of investing.
Note that the following MarketSmith charts are built with Investors Business Daily’s product suite.
I am an Investors Business Daily (IBD) partner and promote the use of their products. The entire platform offers a good mix of technical and fundamental data and education.
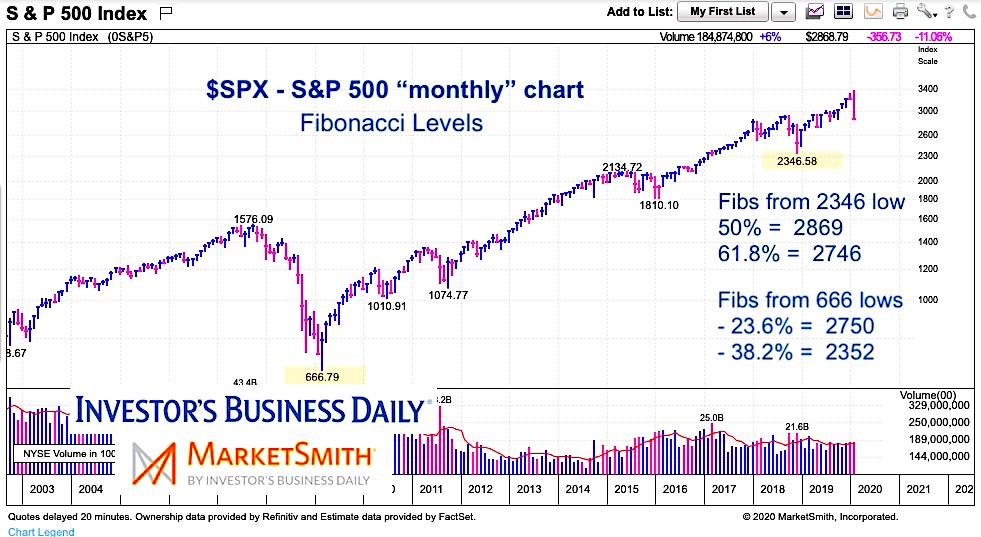
S&P 500 Index “Monthly” Chart
This chart shows how strong the bull market has been off the 2009 lows. Note, though, that it is a log chart so the 500 point decline looks like a blip. It’s not – and it’s retraced nearly 20 percent of the entire bull market from 2009.
So after 7 days of panic and a sharp correction, what levels am I watching. From an intermediate-term view, using the December 2018 lows (2346), a 50 percent Fibonacci retracement takes us to 2869, and a 61.8 percent Fibonacci retracement takes us to 2746. From a long-term view, using the March 2009 lows (666), a 23.6 percent Fibonacci retracement takes us to 2750, while a 38.2% Fibonacci retracement takes us to 2352. A move below 2746/2750 would take the stock market from correction to bear market.

Twitter: @andrewnyquist
The author may have a position in mentioned securities at the time of publication. Any opinions expressed herein are solely those of the author, and do not in any way represent the views or opinions of any other person or entity.


