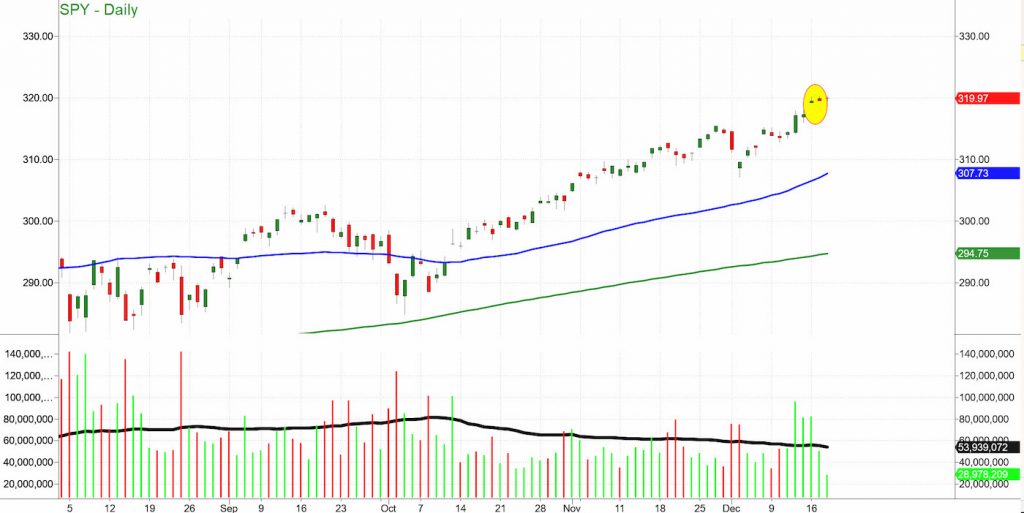
Day 3 and our sloppy shooting star scenario still plays out in the S&P 500.
What struck me about the chart of the SPDR S&P 500 ETF NYSEARCA: SPY, was the volume patterns that accompanied the potential shooting star formation.
However, after great volume (better than the daily average) on December 13, 15, and 16, today, the volume was scant in comparison.
As we have learned, shooting stars (even sloppy ones) could be a sign that the end of this rally is near.
I call this pattern sloppy because the opening and closing prices were not close enough.
Nevertheless, with two highs at 320.25 and a red close, should the price decline Thursday, bears may get yet another chance to go short with a tight stop.
However, if the S&P 500 ETF (SPY) rise and hold over 320.25, than we can consider it a false signal or a consolidation pattern, where overbought conditions get resolved with time rather than with a price correction.
That is precisely why we need to check in with the Economic Modern Family to see what information they offer us.
Before we go into the Family’s performance, another note on junk bonds.
We said that junk bonds JNK, head into the euphoria stage around 110.
Today’s high was 109.98. The relative strength on the daily chart is overbought at nearly 100%.
Euphoria is here. And wouldn’t that be just the perfect time for the shooting stars to play out, she says cynically?
As far as the Economic Modern Family, as predicted, Granny Retail XRT played more catch up. Granny get your guns, because we need you to shoot a bullseye.
Transportation IYT, took a hit with the dismal earnings performance in Fedex. That’s a key component of the market as it represents consumer demand. In other words, we need to see demand grow not shrink.
Biotechnology IBB, a leader in the current rally, took a breather. Some news about the U.S. buying drugs cheaper from Canada could explain the red day.
Regional Banks failed to hang onto its early gains. Not so worrisome at this point.
Sister Semiconductors also took a breather. Whether that turns into a more significant correction remains to be seen.
The Russell 2000 IWM gained in price. The interpretation is that investors are optimistic that the manufacturing sector will grow. That is the best sign from the Family. Clearly IWM cannot falter here.
After a euphoric move in junk bonds, a potential bearish signal in SPY should recent lows break, and a Family that hinges hopes on supply nore than on demand, Santa’s sleigh carries tricks and treats.
Have a listen to my interview on Benzinga Pre-Market Show from this morning-starts around minute 18. https://www.youtube.com/watch?v=VXTCJcGC4yI&feature=youtu.be
S&P 500 (SPY) 316.20 or the 10 day moving average support is important for traders. 320.25 is the all-time high. Watch for any selling under the last 2-day lows.
Russell 2000 (IWM) 163.25 is trading price support. Must clear and hold over 165.10 to keep going. It did this intraday but backed off by market close.
Dow Jones Industrials (DIA) Inside day for price. 281.10 is price support with all time highs at 284.11
Nasdaq (QQQ) has small breakaway gap, 206.25 or the 10 day moving average is support. 210.13 is new all time highs.
KRE (Regional Banks) 57.52 is price support, with 59.50 resistance.
SMH (Semiconductors) initial price support at 140.93, then 137.40 support. 142.20 is the all time high.
IYT (Transportation) 195 is still key pivotal price area with 192.35 key support.
IBB (Biotechnology) 116.30 is key price support while 122.97 is the 2018 high.
XRT (Retail) 45.41 cleared but is now pivotal price support.
Twitter: @marketminute
The author may have a position in the mentioned securities at the time of publication. Any opinions expressed herein are solely those of the author, and do not in any way represent the views or opinions of any other person or entity.


