The past month has been a rough one for investors, watching the S&P 500 drop just over 10 percent to qualify as a “correction”.
Will a low form here? Or will it get worse?
The S&P 500 has bounced for two days and bulls are hoping for a bottom. But hope isn’t a plan.
Today we look at two key guideposts to watch that will determine what comes next.
Note that the following MarketSurge charts are built with Investors Business Daily’s product suite.
I am an Investors Business Daily (IBD) partner and promote the use of their products. The entire platform offers a good mix of tools, education, and technical and fundamental data.
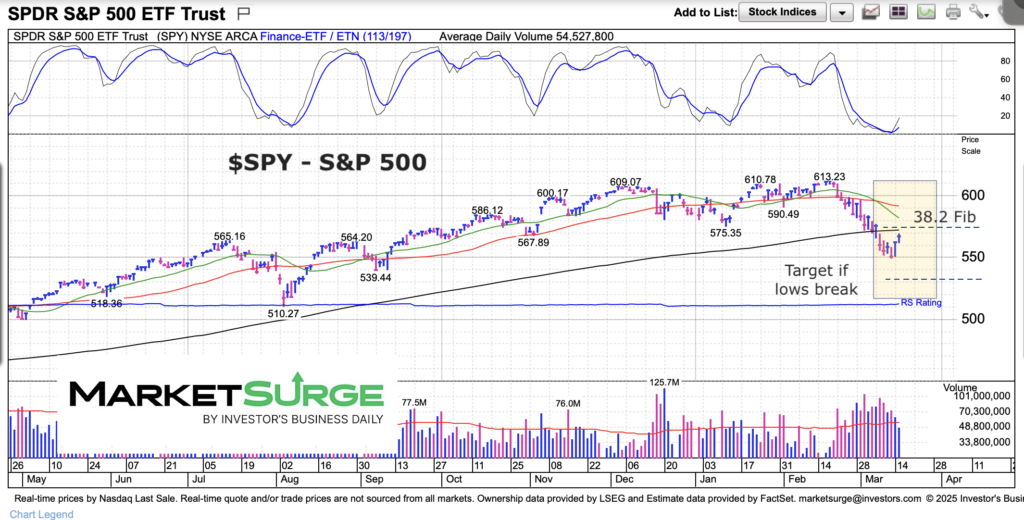
$SPY – S&P 500 ETF Chart
Looking at the two day bounce, we can see that $573 represents the 38.2 Fibonacci retracement of the top-to-bottom decline. The 200-day moving average is there as well. This area marks important price resistance. A move above this level would be good for bulls.
That said, should the recent lows fail to hold then we should see a move down to the $530 area (measured move).
Twitter: @andrewnyquist
The author may have a position in mentioned securities at the time of publication. Any opinions expressed herein are solely those of the author, and do not in any way represent the views or opinions of any other person or entity.

 Trying to Bottom?")
 Is Telling Broader Stock Market?")


 Is Telling Broader Stock Market?")
 Trying to Bottom?")