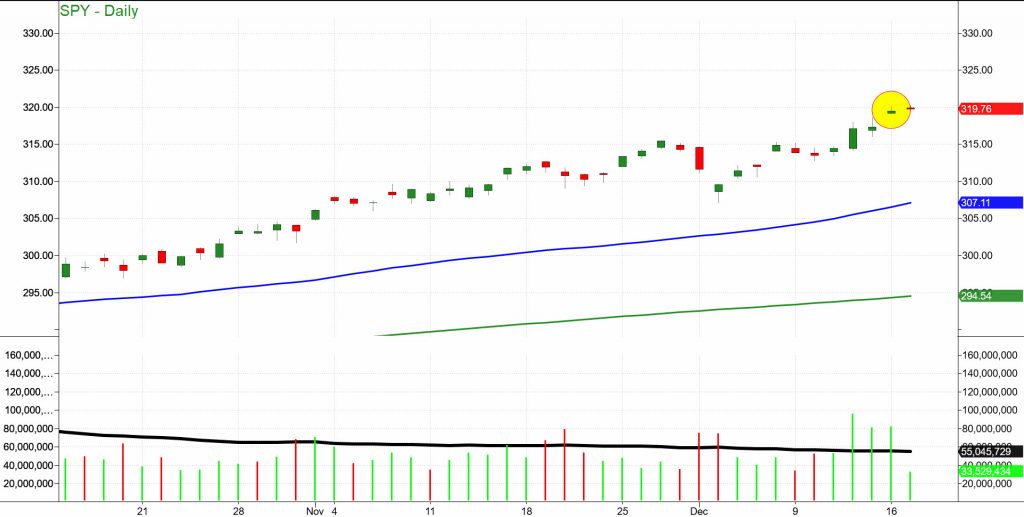
A shooting star is a type of candlestick formation that forms when the open and closing prices of a financial instrument are practically the same.
What strikes me about this chart of the S&P 500 ETF (SPY) – and the Index – is the volume patterns that accompany the potential shooting star formation.
Note the volume of the last three days until today.
December 13, 15, and 16, the daily volume on the S&P 500 exceeded the average (black line).
That and the shooting stars could be a sign that the end of this rally is near.
Shooting stars will appear during large price advances as the one we see in the chart featured.
If the price declines tomorrow for example, bears may get yet another chance to go short with a tight stop.
However, if the price on the S&P 500 ETF (SPY) rises after these shooting stars, than we can consider it a false signal.
Interestingly, today the market saw money rotation into our tired old Granny Retail Sector ETF (XRT).
Wouldn’t it be ironic if XRT finally wakes up, just as the stock market is ready to roll over?
Last night, we compared the market to an overstuffed pastrami sandwich.
Our evidence is the junk bonds JNK, that we said heads into the euphoria stage around 110.
Today’s high was 109.76. The relative strength on the daily chart is nearly 100%.
Couple that with the potential shooting stars and blow off volume in SPY, and we immediately think of this famous quote:
Sir John Templeton:
“Bull markets are born on pessimism, grow on skepticism, mature on optimism, and die on euphoria. The time of maximum pessimism is the best time to buy, and the time of maximum optimism is the best time to sell.”
Which brings us to another quote when we think about Granny Retail XRT:
“Don’t always trust what you see. In a bull market even a duck looks like a swan.”
― Vijay Kedia
So, yay Granny for getting money flow today.
Thus, we conclude with a quote from yours truly:
Yet careful as tomorrow, should JNK falter and SPY crack, Granny could go from a honk to a quack!
Tonight, December 17th, I am hosting a free webinar-please join at 8:30 PM ET https://marketgauge.lpages.co/mmma-20191217-mish/
S&P 500 (SPY) 315.40 the 10 DMA support. 320.25 new all-time high. Watch for any selling under the last 2-day lows or 319.17.
Russell 2000 (IWM) 162.80 support and must clear 165.10 to keep going
Dow (DIA) 280.50 the support with a ATH at 284.11
Nasdaq (QQQ) With a small breakaway gap, 205.55 or the 10 DMA support 209.71 new ATH.
KRE (Regional Banks) 57.52 support, 59.50 resistance.
SMH (Semiconductors) inside day so want to see this hold 140.93, then 136.40 support. 142.10 the ATH.
IYT (Transportation) 195 is still key pivotal area with 192.35 key support.
IBB (Biotechnology) 116.30 key support 122.97 the 2018 high.
XRT (Retail) 45.41 must clear. 44.15 major support.
Twitter: @marketminute
The author may have a position in the mentioned securities at the time of publication. Any opinions expressed herein are solely those of the author, and do not in any way represent the views or opinions of any other person or entity.


