Investors have experienced multiple days of selloffs and failed rallies.
Friday tried to change that.
After another early steep selloff, the stock market mounted a strong comeback in the afternoon. Before we knew it, the major indices were green.
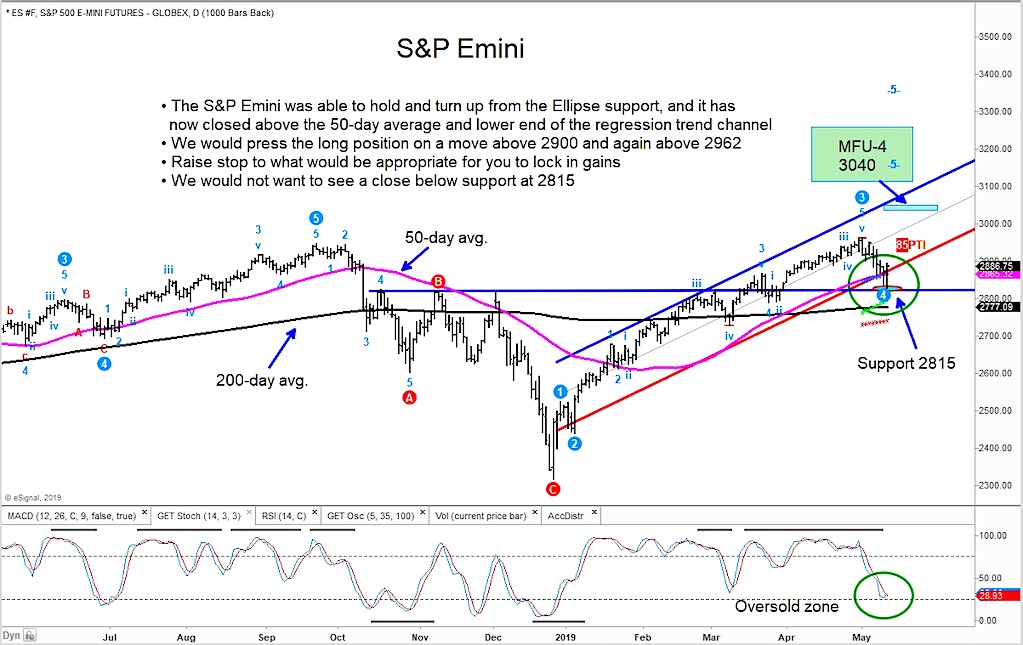
This kick save is also important because it occurred on Friday (the end of the week for weekly charts). The S&P 500 Index closed above its 50 day moving average, a sign of resilience.
Looking at the chart below, it’s clear that investors need to have tight stops where it matters. In this case, any close below 2815 would be bearish.
On the bullish side of the ledger, a close back above 2900 would be strong for bulls. It is imperative that active investors have a plan here… the market is unpredictable here. Play the levels and let the price action lead you.
S&P 500 “daily” Chart

The author has positions in mentioned securities at the time of publication. Any opinions expressed herein are solely those of the author, and do not in any way represent the views or opinions of any other person or entity.


