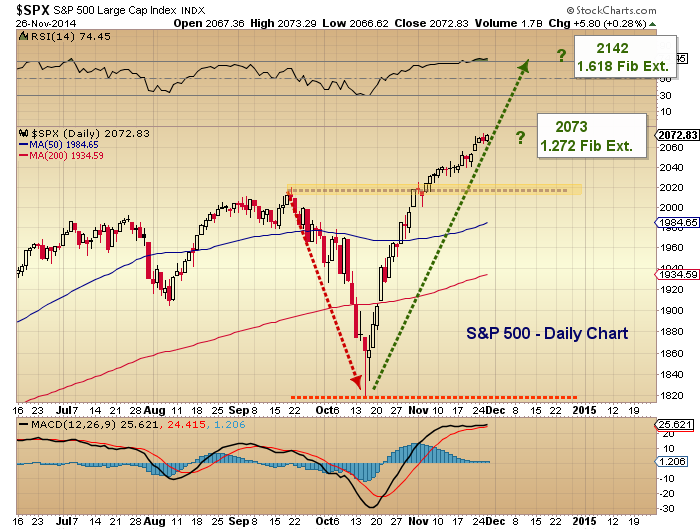
The relentless grind higher continues for the S&P 500 (SPX – Quote), as the broad equity index recorded a record high closing of 2072.83 heading into the holiday. What’s interesting about that closing price is that it aligns perfectly with a key resistance level for the S&P 500: The 1.272 Fibonacci extension at 2073.
I posted about this key resistance level last week following the Chinese central bank rate cut. Should the market decide to push higher from here, the next key resistance levels are 2100 (round number) and 2142 (the 1.618 Fib extension). But with the daily Relative Strength Index (RSI) up over 74 – and the market up almost 14% in 6 weeks – the odds favor a pullback.
Note that key support resides around 2020-2030 and down at the 50 day moving average (1985 and rising).
Below is the S&P 500 chart that I shared last week, updated with the recent price action. Trade safe and happy turkey day.
S&P 500 Daily Chart
Follow Andrew on Twitter: @andrewnyquist
Author holds net short exposure in the S&P 500 at the time of publication. Any opinions expressed herein are solely those of the author, and do not in any way represent the views or opinions of any other person or entity.


